

By Saad Iqbal
It’s 6:40 a.m. and the test separator on your pad has a waiting list. Three wells need their monthly allocation test, the separator can only hold one at a time, and the production meeting is in under two hours. Somewhere on that list is the well you actually care about the one whose choke setting you changed last week and have no idea whether it helped or hurt. By the time the separator gets to it, the data will be a week stale.
This is the problem virtual flow metering was built to solve. Instead of waiting for a physical test, a virtual flow meter (VFM) turns the pressure, temperature, and choke data your wells are already streaming into a continuous, per-well estimate of oil, gas, and water rate, updated every few minutes instead of every few weeks. The AI layer on top of that idea is what has changed the most in the last two years: models that used to be static physics correlations are now blended with machine learning that corrects for drift, learns from every new well test, and flags when a well has quietly moved outside the conditions the model was built for.
What Is Virtual Flow Metering, and Why Is Every Pad Asking for It?
A virtual flow meter is a software model, not a piece of hardware in the flow line. It takes continuous SCADA inputs, wellhead pressure, wellhead temperature, choke position, gas-liquid ratio, water cut, and runs them through a model that was calibrated against a handful of real well tests to output a standing estimate of flow rate. No separator, no multiphase meter, no shut-in.
Three things pushed adoption hard this cycle: test separators are a shared, finite resource on multi-well pads; subsea and high-rate multiphase meters cost tens of thousands of dollars per well to install and maintain; and production teams now have far more historical SCADA data to train a model on than they did five years ago. Put an AI correction layer on top of a decades-old physics correlation, and you get something that is both explainable and adaptive, which is exactly what an engineer who has to defend an allocation number in a partner meeting wants.
It also changes who gets to ask “what if.” A production engineer testing a new choke setting no longer has to wait a month to see whether it moved the needle; the virtual rate updates within the hour, long before the next scheduled well test would have told them anything at all. That shorter feedback loop is quietly reshaping how often engineers are willing to experiment with choke and artificial-lift setpoints in the first place, because the cost of being wrong for a week has dropped to the cost of being wrong for an hour.
How an AI-Based Virtual Flow Meter Actually Works
Most production-grade VFMs run two layers stacked on top of each other. The first is a physics-based backbone, a choke performance relationship or an inflow performance correlation that converts pressure and temperature into a first-pass rate estimate. The second is a statistical or machine-learning correction layer, trained on the gap between that physics estimate and the actual well tests you’ve recorded over time. That second layer is what absorbs the things the physics equation doesn’t know about: scale building up in the choke, a slightly miscalibrated pressure transmitter, or a GLR that’s drifted since the last test.

Retraining cadence matters more than model choice. A model retrained every time a new well test comes in will track real decline and intervention effects; one trained once and left alone will quietly drift for months before anyone notices the allocation numbers don’t add up to the sales meter anymore.
The Best AI Virtual Flow Metering Tools and Platforms Right Now
1. KBC Acuity Virtual Flow Meter
KBC Acuity Virtual Flow Meter, part of Yokogawa’s KBC Acuity Industrial Cloud Suite, is built specifically around the “production twin” idea: a continuously updated digital model of every well on the pad, with the virtual meter as one layer of that twin. It’s the closest thing on this list to a turnkey, vendor-supported VFM, you’re buying a calibrated service, not building one from scratch.
2. Build Your Own: Python, pandas, and scikit-learn
If you have more SCADA history than budget, a surprising number of operators are rolling their own VFM in Python using pandas for data wrangling and scikit-learn for the correction layer, developed and iterated in Jupyter notebooks. It’s more work up front, but you own the model, you can see exactly why it predicted what it predicted, and you’re not paying a per-well SaaS fee for a field of twelve wells.
3. petropt for the Physics Layer
Whichever route you take, you still need the physics backbone underneath the correction layer. petropt is an open-source Python library built for exactly this: PVT correlations, IPR curves, decline analysis, and multiphase flow and hydraulics functions you’d otherwise have to code from a textbook. Dropping it under your own ML correction layer saves you from re-deriving correlations you can verify against SPE literature anyway.
4. Power BI or Looker Studio for Delivery
A model nobody looks at doesn’t change anything. Whether you’re on the KBC platform or a home-grown notebook, piping the per-well output into Power BI or Google Looker Studio is what actually gets a production engineer checking it every morning instead of once a quarter.
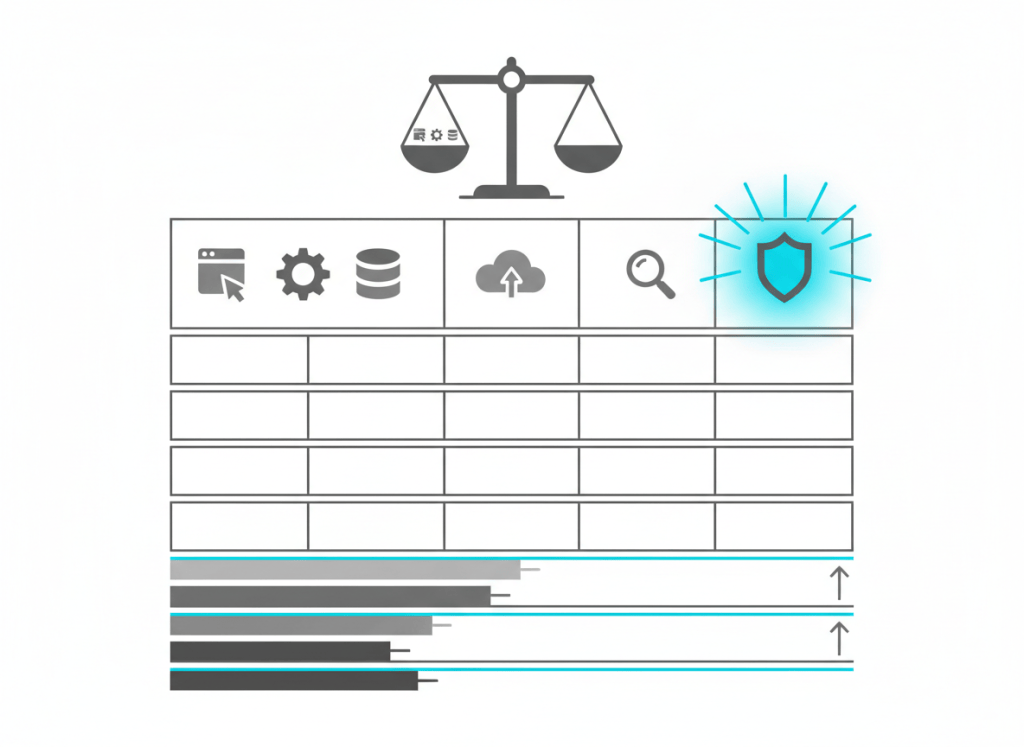
Calibrate Against Ground Truth: Why Physical Meters Still Matter
No virtual model is better than the data it was calibrated against. Reference-grade physical multiphase meters, like Emerson’s Roxar multiphase flow meters, aren’t competing with your VFM, they’re what you periodically trust it against. A practical pattern many operators use: install a permanent multiphase meter on one or two “reference” wells per pad, and let every virtual model on the pad recalibrate against that continuous ground truth instead of a monthly test separator run.

How Accurate Is a Virtual Flow Meter, Really?
Accuracy isn’t a single number you can quote off a spec sheet, it depends on how recently the model was calibrated, how wide a range of conditions it was trained across, and how far the well has drifted since. The honest way to track it is mean absolute percentage error (MAPE) against held-out well tests the model never saw during training:
import pandas as pd
from sklearn.model_selection import train_test_split
from sklearn.ensemble import RandomForestRegressor
from sklearn.metrics import mean_absolute_percentage_error

# historical_data.csv: whp_psi, wht_degF, choke_pct, gor_scf_bbl,
# watercut_pct, and test_rate_bbl_d (the measured well-test rate)
df = pd.read_csv("historical_data.csv")

features = ["whp_psi", "wht_degF", "choke_pct", "gor_scf_bbl", "watercut_pct"]
X = df[features]
y = df["test_rate_bbl_d"]

X_train, X_test, y_train, y_test = train_test_split(
    X, y, test_size=0.2, random_state=42
)

model = RandomForestRegressor(n_estimators=300, max_depth=8, random_state=42)
model.fit(X_train, y_train)

predicted_rate = model.predict(X_test)
mape = mean_absolute_percentage_error(y_test, predicted_rate)
print(f"Virtual flow meter MAPE vs well test: {mape:.1%}")
Run that MAPE check every time a new well test lands, not once at deployment. A model that scored well six months ago and hasn’t been checked since is a liability, not an asset. Log the MAPE trend itself, not just the latest value, so a slow creep in error shows up before it becomes an allocation dispute.

A Practical Rollout Checklist
None of this works if it’s bolted on in a week. Treat the first rollout as a calibration project, not a software install:
- Pull at least 12 months of SCADA history per well, pressure, temperature, choke position, and every well test on record.
- Start with a physics-based baseline (a choke or IPR correlation, via a library like petropt) before adding any ML correction layer.
- Hold out the most recent 20% of well tests to validate blind, never report accuracy on data the model trained on.
- Define explicit recalibration triggers: a choke change, a workover, an artificial lift intervention, or GLR drift past a set threshold.
- Decide up front whether the output is allocation-grade or fiscal-grade, and don’t let it get used for the latter until it’s proven against the former.
Common Pitfalls
- Treating day-one output as fiscal-grade. A freshly calibrated VFM is an allocation tool first. Let it earn fiscal trust with a track record.
- Skipping retraining after a choke or lift change. The model doesn’t know the well’s plumbing changed, it will keep predicting against conditions that no longer exist.
- Training on a narrow operating window. A model built only on high-rate data will extrapolate badly once the well declines into a regime it never saw.
- Letting one bad well test poison the whole calibration. A single mis-recorded separator reading can pull an otherwise good model off track for months; always sanity-check a new well test against the model’s own prediction before feeding it back in as ground truth.
Virtual flow metering pairs naturally with the rest of your production-optimization stack. If you’re already tracking well-level decline behavior, it’s worth reading our breakdown of AI tools for upstream production data analytics, and if your wells are on nodal analysis workflows, see our comparison of nodal analysis software. For artificial-lift wells specifically, pair your VFM output with the diagnostics covered in AI ESP failure prediction, a sudden gap between virtual rate and ESP amp draw is often the earliest sign something downhole has changed. And for the Python side of this workflow, the related tutorial on automating Arps decline curve analysis in Python is a natural next read.
