

By Saad Iqbal
This nodal analysis software comparison starts with a familiar production-engineering problem: it is 11 p.m., you are three redesigns into a gas-lift review and the well still will not come off decline. The old spreadsheet uses a hard-coded Vogel curve and a VLP line traced by eye from a PROSPER printout. Twenty minutes later you have a new intersection, no confidence that it is right and four more wells to review before the morning meeting.
Every production engineer has lived some version of that night. The calculation at the center of it — nodal analysis — is not exotic. It is one curve going down, one curve going up, and a dot where they cross. What eats the evening is the software: which tool actually plots that intersection fast, correctly, and in a way you can hand off to the next well without starting over. This is a straight comparison of the nodal analysis software upstream engineers are actually running in 2026, what each one is genuinely good at, and where a fifteen-line Python script beats all of them.
What Is the Best Nodal Analysis Software in 2026?
There isn’t one answer, because “best” depends on what’s actually failing in your workflow. If you’re modeling a single well test in the field with no license server in sight, the enterprise IPM suites are overkill. If you’re reconciling forty wells into a gathering-network model for a facilities debottlenecking study, a browser-based single-well plotter won’t get you there. The five tools below split roughly into three tiers: full integrated production modeling platforms built for network-scale work, lightweight plotting tools built for speed, and code — which costs nothing but your own time to set up.
The one thing every option on this list has to do well is the same thing: find where inflow meets outflow.
How Nodal Analysis Actually Works: IPR Meets VLP
Split the well at a node — usually the bottomhole — and you get two independent curves that both describe the same point in space. The Inflow Performance Relationship (IPR) says how much the reservoir will give up at a given bottomhole flowing pressure; as Pwf drops, more fluid flows in, but the relationship curves because relative permeability and gas breakout below the bubble point aren’t linear. The Vertical Lift Performance (VLP) curve says the opposite thing from the wellbore’s side: it’s the pressure the tubing string needs at bottomhole to lift a given rate to surface, and it rises with rate because friction losses grow faster than the hydrostatic column shrinks.
Plot both against rate on the same axes and there’s exactly one point where the well can physically operate — the intersection. Every piece of software on this list exists to find that point faster and more reliably than you can by hand.

Move the operating point and you’re doing real engineering: a smaller tubing size shifts the VLP curve up and left, a new perforation interval reshapes the IPR, a gas lift valve changes the whole outflow relationship above the injection point. Nodal analysis software is really just a fast way to re-draw both curves every time you change one input, instead of re-deriving them by hand each time.
The 5 Nodal Analysis Tools Worth Knowing
1. PROSPER / IPM — Petroleum Experts
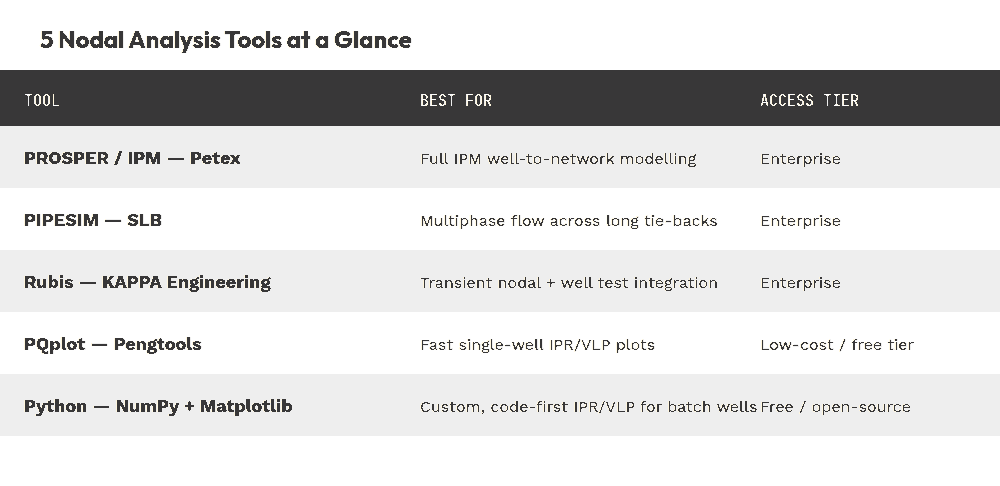
PROSPER is the well-modeling core of Petroleum Experts’ IPM suite, and for a lot of operators it’s still the reference tool nodal analysis gets measured against. It handles complex completions — multilateral wells, gas lift, ESPs, coiled tubing velocity strings — and matches them against a real PVT model rather than a generic correlation. The payoff is that when you link PROSPER to GAP for network modeling, you’re doing full field-level nodal analysis, not just single-well plots. The cost is a proper license and a learning curve that rewards people who use it every week.
2. PIPESIM — SLB
PIPESIM is SLB’s steady-state multiphase flow simulator, and it earns its keep on anything with a long tie-back or a gathering network attached to the well. Where PROSPER’s strength is the well itself, PIPESIM is built to carry that same nodal logic downstream through flowlines and risers to a facility inlet. If your bottleneck is genuinely in the pipeline rather than the wellbore, this is the tool that will show you where.
3. Rubis — KAPPA Engineering
Rubis comes out of KAPPA’s well-test analysis heritage, and it shows: it’s the strongest option here for engineers who want their nodal model built directly from a validated pressure transient interpretation instead of a hand-entered IPR guess. If you’re already running Ecrin for well test analysis, feeding that same reservoir model straight into a transient nodal analysis in Rubis removes a whole layer of re-entry error.
4. PQplot — Pengtools
PQplot is the opposite end of the spectrum: a fast, low-cost, single-well IPR/VLP plotting tool with none of the network-modeling overhead. It won’t replace PROSPER for a facilities study, but if you need to sanity-check one well’s operating point between meetings, it’s the quickest way there that isn’t a spreadsheet.
5. Python — NumPy + Matplotlib
The free option, and the one most engineers underrate. Vogel’s IPR equation and a basic VLP friction model are both short enough to write from scratch, which means you can batch them across every well in a field in the time it takes a GUI tool to open. It’s genuinely the strongest option when you need the same nodal calculation run identically across fifty wells rather than tuned by hand on one — see the next section for exactly how to set it up.
Automate Your Own IPR Curve in Python (Vogel’s Equation)
Vogel’s (1968) equation is the standard IPR shape for a solution-gas-drive well producing below bubble point. It relates flow rate to bottomhole flowing pressure as a fraction of the well’s absolute open flow (AOF, the theoretical maximum rate at Pwf = 0):
qo / qo,max = 1 − 0.2(Pwf/Pr) − 0.8(Pwf/Pr)²
where Pwf is bottomhole flowing pressure (psi), Pr is average reservoir pressure (psi), qo is oil rate at that Pwf (STB/D), and qo,max is the AOF (STB/D). Given one measured test point — a known rate at a known flowing pressure — you can solve for qo,max and then generate the full curve.
Worked example: reservoir pressure Pr = 3,000 psi, a well test showing 400 STB/D at Pwf = 2,000 psi. That gives x = Pwf/Pr = 0.667, and 1 − 0.2(0.667) − 0.8(0.667)² = 0.511, so qo,max = 400 / 0.511 ≈ 783 STB/D. That AOF is what lets you draw the rest of the curve.
import numpy as npdef vogel_ipr(pr, pwf_test, qo_test, n_points=25): """Vogel (1968) IPR for a solution-gas-drive well below bubble point.""" x_test = pwf_test / pr qo_max = qo_test / (1 - 0.2 * x_test - 0.8 * x_test**2) pwf = np.linspace(0, pr, n_points) x = pwf / pr qo = qo_max * (1 - 0.2 * x - 0.8 * x**2) return pwf, qo, qo_maxpwf, qo, qo_max = vogel_ipr(pr=3000, pwf_test=2000, qo_test=400)print(f"AOF (qo_max) = {qo_max:.0f} STB/D")# AOF (qo_max) = 783 STB/D
That’s the entire IPR side automated, and it’ll run identically across a hundred wells in a loop. The honest limitation is the VLP side: a real vertical lift curve needs a validated multiphase correlation — Hagedorn-Brown or Beggs-Brill — to handle friction, hydrostatic head, and gas slippage correctly across flow regimes, and that’s genuinely complex enough that it’s the reason PROSPER and PIPESIM exist as products rather than open-source scripts. Where this gets useful in practice: pull your PVT inputs (bubble point, solution GOR, formation volume factor) with a library like petropt, feed them into your own IPR loop, and reserve the commercial VLP engine for the one calculation that actually justifies the license.

Push the output into Power BI or Looker Studio and every well’s operating point updates itself the next time production data lands, instead of waiting for someone to open a GUI and redraw it.
Which Nodal Analysis Tool Should You Actually Use?
- You manage a full field and need network-level nodal analysis: PROSPER/IPM or PIPESIM — the license pays for itself the first time it catches a bottleneck in the flowline instead of the well.
- You already run well test interpretation in Ecrin: Rubis, so the reservoir model you validated in the transient analysis carries straight into the nodal plot without re-entry.
- You need one quick answer before a meeting: PQplot — open it, plug in the test point, done.
- You’re re-running the same calculation across dozens of wells every week: Python. Build it once, and it costs nothing to run again.
None of these tools replace the judgment call at the center of nodal analysis — deciding which curve actually needs to move to fix the well. What they change is how many minutes it costs you to find out, and after enough 11 p.m. gas lift reviews, that’s the number that matters. If artificial lift is where your bottleneck usually lives, the related read below on AI-driven ESP failure prediction is worth the ten minutes.
For more on where AI is actually earning its keep in upstream production — not the hype, the tools engineers are running this week — see how AI predicts ESP failures before they happen and how to speed up decline curve analysis with AI.
