
By Saad Iqbal
A production engineer has years of pressure, rate, temperature and motor-current history, yet still exports spreadsheets to investigate a small set of wells. AI production data analytics tools can help connect that history to well context, repeatable surveillance and a useful review queue. The right choice depends on the task, integration requirements and maintenance capacity—not a blanket claim that every platform is now cheap or simple.
Why Your Historian Isn’t Enough On Its Own
A historian stores operational time-series data under configured sampling, compression and retention policies. Do not assume every raw value is retained indefinitely or that all exports have identical precision. Modern operational-data platforms may already provide contextualization, calculations and visualization. Before adding another layer, check what your current system supports and which specific engineering question remains difficult to answer.

Build the business case from your own asset. Record the existing review workload, actionable-event detection time and verified production losses. Then measure whether an intervention changes those outcomes, separating analytics value from workover effects, operating changes and commodity prices. Subtract implementation, licensing, support and instrument-maintenance costs. A headline savings figure from another asset is not a defensible forecast for yours.
How Does the Historian-to-Insight Pipeline Actually Work?
A practical evaluation can follow five functions: collect data, check quality, map signals to equipment, analyze the relevant operating state and deliver an auditable review. Different platforms cover these functions differently; some may require additional integrations or engineering configuration.

Start with the sensor tags and their quality flags, timestamps and units. Map each tag to the correct well, equipment and measurement definition. Choose a baseline that represents the operating regime rather than automatically using a fixed 90-day window. A deviation should arrive with supporting trends and event context, so an engineer can distinguish a planned choke change, a faulty sensor and a potential production issue.
4 AI Production Data Analytics Tools to Evaluate
These tools aren’t interchangeable, and the biggest mistake teams make is buying the market leader without checking whether it solves their specific bottleneck.
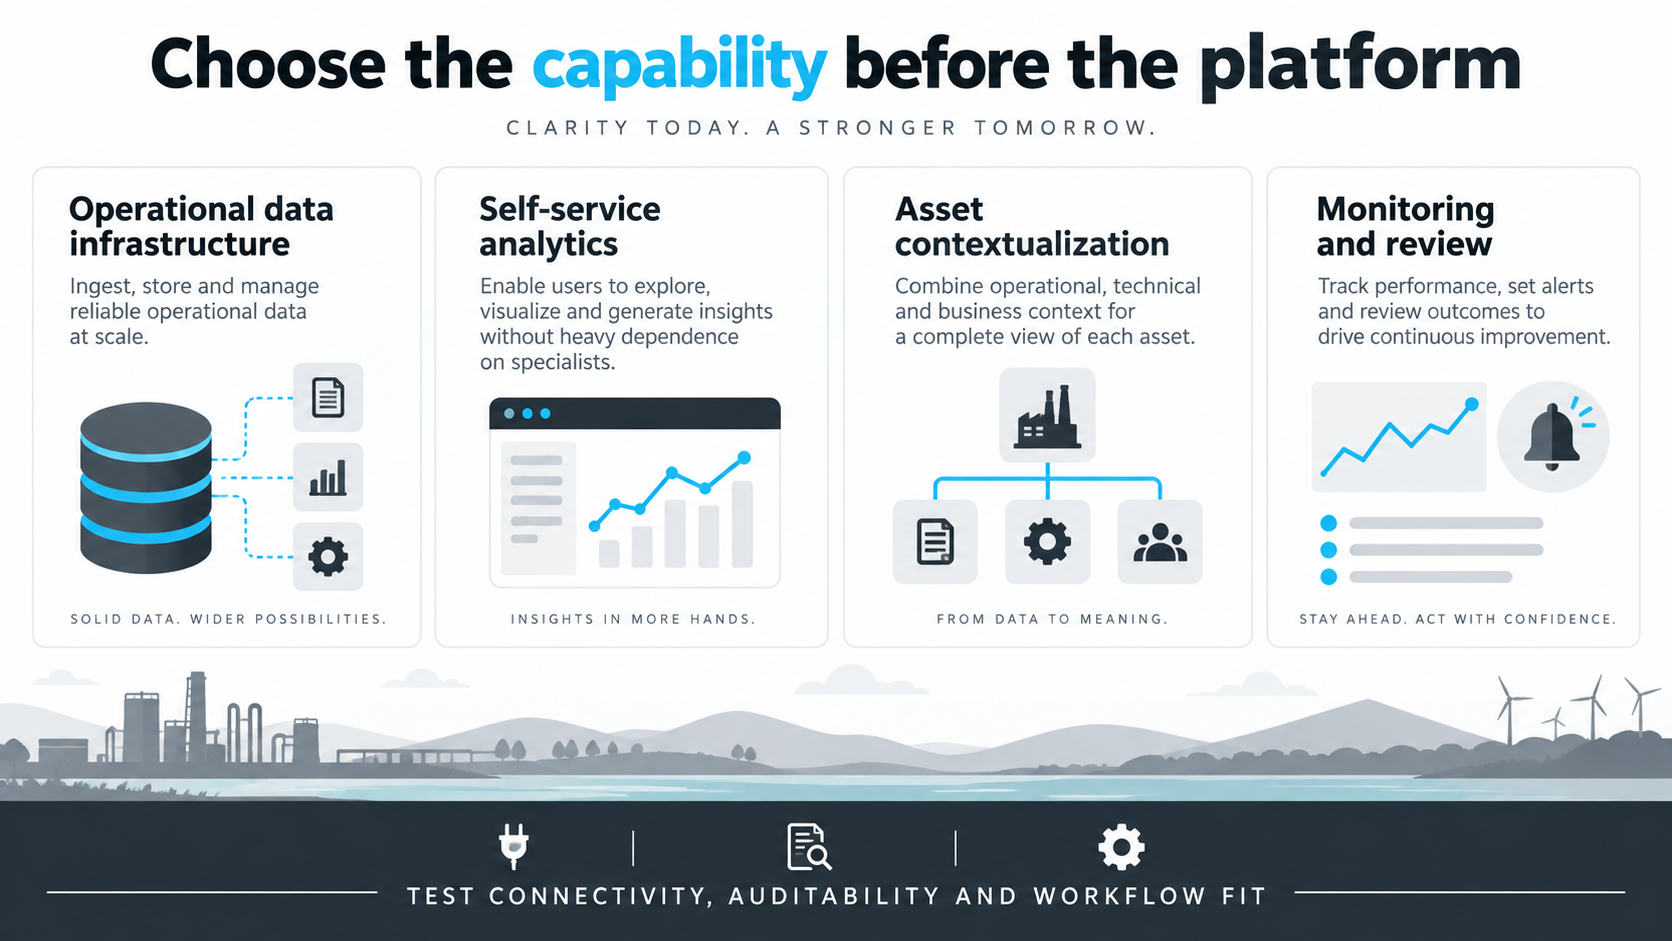
- AVEVA PI System provides operational-data infrastructure spanning collection, management, contextualization and visualization. Evaluate the capabilities already licensed before assuming a separate analytics product is required.
- Seeq is built for self-service trending and pattern search by engineers, not data scientists — the tool you hand a production engineer who wants to find “every time this pump behaved like it’s behaving now” without writing a query.
- Cognite Data Fusion connects and contextualizes operational, engineering and IT data. Review how mappings are validated, maintained and exposed to downstream applications.
- TrendMiner describes time-series and event analytics, statistics, machine learning, reporting and monitoring. Test whether those workflows fit your production use case rather than assuming an anomaly alert predicts a failure.
Shortlist AI production data analytics tools against a written use case. Ask suppliers to demonstrate your data connection, well hierarchy, quality handling, permissions and review workflow. Confirm deployment and licensing terms directly. A platform order that works for one operator is not a universal roadmap, and no product comparison replaces a scoped pilot.
| Platform | Core strength | Typical buyer |
|---|---|---|
| AVEVA PI System | Operational-data infrastructure | Teams needing operational-data infrastructure |
| Seeq | Self-service trend and pattern search | Production and reliability engineers |
| Cognite Data Fusion | Cross-historian contextualization | Larger operators with fragmented data sources |
| TrendMiner | Time-series analytics and monitoring | Teams focused on early degradation warnings |
What Should You Actually Watch For Drift?
Start with a bounded surveillance question. For gas lift, compare injection rate and casing pressure with operating changes. For ESPs, review current and vibration alongside frequency, rate and interventions. For production allocation, examine changes in water cut, gas–oil ratio and test history. These are screening signals, not unique diagnoses. Measure detection delay and false alarms in your pilot rather than promising alerts weeks earlier on every well.
Do You Need an AI Platform, or Just Better Excel?
For a periodic review of a small dataset, Python, pandas and Jupyter can support transparent calculations without an enterprise analytics subscription. You still need controlled inputs, tested logic, versioning and someone responsible for maintenance. Larger continuous deployments add requirements for integration, access control, monitoring, support and audit trails. Those requirements—not simply the well count—drive the platform decision.
Getting Started This Quarter
- Audit what’s already contextualized. Before buying anything, find out how many of your historian tags already have clean, human-readable names tied to specific equipment. That gap is usually the real first project, not the analytics layer sitting on top of it.
- Pick one recurring pain point, not a platform-wide rollout. Gas lift optimization, ESP surveillance, or decline curve tracking are common starting points — narrow enough to prove value in a quarter, broad enough to matter to the business.
- Put the output somewhere engineers already look. A brilliant anomaly-detection model that emails a PDF nobody opens delivers zero value. Whether that’s a Power BI dashboard or a native alert inside the platform itself, the delivery channel matters as much as the model.
A few pitfalls worth knowing before you sign a contract or write the first pattern-detection script:
- Garbage tags in, garbage alerts out. If a sensor has been drifting uncalibrated for two years, an AI model will faithfully learn that drift as “normal” and miss the actual problem when it shows up. Data quality work isn’t optional groundwork — it’s most of the project.
- Alert fatigue kills adoption faster than a bad model. A system that flags fifty “anomalies” a day trains engineers to ignore all of them, including the one that matters. Tune thresholds using reviewed events and the relative cost of missed events versus false alarms; document the acceptance criteria.
- Budget for contextualization and maintenance. Mapping tags to equipment may be substantial work. Include validation, ownership and change control in the project estimate rather than treating integration as a one-time upload.
What Should Your Pilot Acceptance Test Include?
Use a frozen dataset containing normal operations, known interventions, downtime and data-quality faults. Keep later periods out of model fitting. Ask each candidate to reproduce the same well-level totals and explain every excluded record. AI production data analytics tools should let an engineer trace a dashboard value back to the inputs and calculation version.
Define rate basis explicitly. A flowing-day oil rate of 100 bpd with 12 hours uptime corresponds to 50 barrels that day. If 100 bpd is already a calendar-day rate, multiplying by uptime again incorrectly halves production. Test duplicates, missing dates, negative values and zero-rate periods before evaluating an anomaly model. Preserve missing data as missing unless an approved estimation rule applies.
Score the review workload as well as statistical performance: alerts per well-day, proportion judged actionable, missed known events, lead time and time needed to resolve a flag. An Isolation Forest anomaly score is not a probability of equipment failure. AI production data analytics tools need a failure-labelled validation study before claims about failure probability or remaining life are defensible.
Confirm permissions and data location before connecting operational systems. A pilot should use read-only approved data access, retain audit trails and keep recommendations separate from control actions. Require a fallback when data ingestion stops. Preserve the last timestamp and clearly mark stale results so a polished dashboard cannot hide an interrupted feed.
The Bottom Line
The data your historian has been quietly collecting for a decade is already worth more than most teams are extracting from it. The tools above exist to close that specific gap — not to replace the engineer’s judgment, but to make sure the pattern worth noticing actually reaches someone before the shift ends, not after the well’s been underperforming for a month.
If gas lift or artificial lift performance is the pattern you’re chasing first, our guide to AI tools for artificial lift optimization and the hands-on walkthrough of automating nodal analysis in Python are natural next reads — and if methane and emissions surveillance is next on your list, we cover that ground in our companion piece on AI methane monitoring tools.
Download the EnergyMindAI Production Analytics Studio
I have done the software-building work so you can spend more time investigating your wells and less time assembling another analysis spreadsheet. EnergyMindAI Production Analytics Studio is our companion Windows application for daily, multiwell production surveillance. Start with the included synthetic demo, then bring in your own daily history to explore trends, investigate unusual behavior and prepare an engineering review. It is separate from the commercial platforms compared above.
Download Production Analytics Studio for Windows — 30-day trial (ZIP, approximately 84 MB)
Windows 10/11, 64-bit • Version 1.0.0 • No Python installation required. Download the ZIP and extract the complete folder before running the included application. The interface opens in your browser, but calculations and saved projects run locally on your computer; this is not a cloud service.
What you can do with the tool
Review production at field and well level. Track oil, water and gas trends, uptime, calculated volumes, water cut and gas–oil ratio. Explicit calendar-day versus flowing-day rate settings help prevent double-counting downtime. Input checks flag invalid values, duplicate well/date records and missing-day issues rather than silently treating every record as reliable.
Investigate anomalies and test forecasts. Per-well Isolation Forest screening compares behavior with an initial training baseline, with detrending to reduce alerts caused by ordinary decline. Forecasts use a transparent log-linear model and chronological holdout comparison against a simple baseline. An anomaly score is not a failure probability, and an extrapolated trend is not a reserves estimate.
Compare scenarios and retain your work. Explore the built-in scenario laboratory, adjust assumptions, save analysis snapshots in local project history, and reopen previous reviews. Export charts and analysis into PDF, Word or Excel for discussion with your team. Reports reflect the last completed analysis, so rerun after changing inputs.
Your inputs and first analysis
Prepare a CSV with date, well, oil_bpd, water_bpd, gas_mscfd and uptime_hours. Use one daily record per well, oil/water rates in barrels per day, gas in thousand standard cubic feet per day, and uptime from 0 to 24 hours. Check the selected rate basis before analysis. These are daily summaries—not a direct live-historian connection.
1. Extract the ZIP and launch the application. 2. Choose Explore demo and follow Getting started. 3. Use Data and settings to import your CSV and review assumptions. 4. Run the analysis; inspect data-quality notes, well surveillance and forecast validation before interpreting flags. 5. Compare scenarios, save a named snapshot in Project history, and export your chosen report from Reports.
How to interpret results responsibly
This first release is an engineering screening aid, not a field-validated substitute for an enterprise production platform. Synthetic demo results demonstrate functionality, not predictive accuracy on your wells. Validate units, allocation changes, interventions, sensor quality and model performance against known operating events before making decisions. Human engineering review remains essential.
Trial and access: the download includes a 30-day free trial. Continued analysis then requires a product-specific monthly authorization code from EnergyMindAI, using the machine code shown in the application’s Trial and authorization section. Existing history and report exports remain available after the trial. This is not an unlimited free license. Contact Saad Iqbal through the LinkedIn profile to request access details.
Before using operational data: follow your employer’s data-handling and software policies. The executable is unsigned, so Windows or your organization may display a publisher-reputation warning or block it. Do not bypass organizational security controls; request IT review where needed.
