
By Saad Iqbal
Three a.m., and the pumper’s phone lights up with a no-flow alarm. By sunrise the field supervisor is staring at a SCADA screen showing a flat line where a producing well used to be: an electrical submersible pump has tripped, the well has gone to zero, and nobody saw it coming — or so it seems. This is precisely the problem AI ESP failure prediction exists to solve: the motor current had actually been drifting off its baseline for three weeks before the trip, quietly, in a chart nobody was watching in real time.
That gap — between when a failure becomes visible in the data and when a human notices it — is exactly the gap modern predictive systems are built to close. Instead of waiting for a trip, models trained on motor current signature analysis, vibration trends, and SCADA telemetry learn what a pump sounds like right before it breaks, and flag the drift while there’s still time to schedule a workover unit and stage a new ESP, instead of scrambling for one after the well has already gone dead.
Why ESPs fail quietly before they fail loudly
An electrical submersible pump is a deceptively simple idea — a multistage centrifugal pump driven by a downhole motor, lifting fluid from thousands of feet below surface — wrapped in a genuinely hostile operating environment. Heat, sand, scale, gas interference, and electrical stress all work on the same handful of failure points: the motor windings, the seal section, the bearings, the cable. None of these fail instantly. They degrade. A winding develops a hot spot before it shorts. A bearing wears before a shaft breaks. Gas interference causes cyclic loading before a pump goes to shutdown on low intake pressure.
The old approach to this degradation is what most engineers still call run-to-failure: the pump operates until an alarm fires or production visibly falls off, and only then does anyone mobilize a response. It’s not that operators don’t collect data — most SCADA systems already log motor current, voltage, intake and discharge pressure, and frequency every minute. It’s that nobody has time to stare at hundreds of amp charts a day looking for a slope that shouldn’t be there. The signal was in the data. The organization just couldn’t see it in time.
What signals does the model actually watch?
Predictive systems don’t need exotic new hardware in most cases — they need to make better use of instrumentation that’s frequently already there. The core signal stack looks like this:
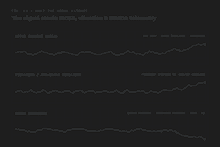
- Motor current signature analysis (MCSA) — the amp draw, phase balance, and harmonic content of the motor’s current waveform, which shifts with rotor bar damage, air-gap eccentricity, and winding insulation breakdown.
- Vibration and amp-chart deviation — trend deviation from a well’s own healthy baseline, not an absolute threshold, since every ESP installation has a slightly different “normal.”
- SCADA telemetry — intake and discharge pressure, motor temperature, operating frequency, and fluid rate, sampled continuously.
- Insulation resistance — a slower-moving signal that tracks cable and motor winding health over weeks and months.
Individually, a blip in any one of these signals is noise. Together, correlated over time, they’re a fingerprint. A rising amp draw paired with a slowly climbing motor temperature and a widening vibration spectrum is a very different story than a temperature spike alone caused by a hot summer day.
How AI ESP failure prediction actually gets made
Raw telemetry isn’t a prediction — it’s a wall of noisy time-series data. Turning it into a usable failure warning generally takes a pipeline with a few distinct stages: engineered features (rolling slopes, deviation-from-baseline, spectral bands) get computed from the raw signals, then fed into a model that scores failure risk and, ideally, estimates a lead time.
The model layer is rarely a single algorithm. A widely cited SPE/Baker Hughes case study on ESP failure prediction describes an ensemble approach — Weibull-based survival analysis on asset-level failure history, machine-learned models trained on pump-level sensor time series, expert rule-based checks against manufacturer specs, and physics-based nodal analysis covering thermodynamics and multiphase flow — blended into one hybrid system rather than relying on any single method. That matters because pure black-box machine learning models trained only on failure labels tend to struggle with how rare true ESP failures are relative to normal operation; folding in physics constraints and domain rules helps the model generalize to wells it hasn’t seen fail yet.
In that same study — evaluated across 254 ESPs from a Latin American operator where roughly 69% of pumps were failing before a 1,000-day target run life — the model reached a balanced accuracy of about 73%, with a 90% true-negative rate (correctly leaving healthy pumps alone) and a 56% true-positive rate on actual failures. Those aren’t perfect numbers, and the study is candid about that. But even an imperfect early warning changes the economics: in one documented case, early detection of a broken shaft let the team schedule an intervention roughly two weeks ahead of an unplanned trip, avoiding an estimated $450,000 in deferred production.

Does AI ESP failure prediction actually work?
The honest answer is: well enough to change decisions, not well enough to remove engineering judgment. No credible published system claims to predict every failure mode with certainty — gas interference, sand production, and electrical faults each leave different signatures, and a model tuned on one basin’s failure patterns won’t transfer cleanly to another without retraining. What the better-documented case studies show consistently is directional value: catching the failures a model can see, early enough to plan instead of scramble, on a meaningful share of a fleet. For a field running dozens or hundreds of ESPs, shaving even a fraction of unplanned pulls into planned ones adds up fast.
Reactive pull-and-replace vs. predictive intervention
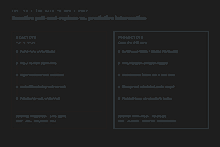
The economic case for catching an ESP failure mode early starts with what an unplanned change-out costs in the first place. A single ESP pull-and-replace — rig or workover unit mobilization, the replacement pump and cable, and the well’s downtime while it waits on equipment — commonly runs anywhere from roughly $150,000 to $500,000 or more, depending heavily on well depth and location. Layer deferred production on top of that during the days or weeks the well sits offline, and an unplanned trip on a high-rate well can easily become a seven-figure event once everything is counted.
Predictive monitoring doesn’t eliminate ESP failures — pumps operating in hostile downhole conditions will always wear out. What it changes is who controls the timing. A planned pull, with the replacement pump already staged and the workover unit booked on the operator’s schedule, is a budgeted line item. An unplanned trip is a fire drill that competes for rig availability with everyone else’s fire drill.
What it takes to build this in-house
You don’t need a data science department to start. A useful first pass looks like: pull historical SCADA and failure-tag data into pandas with Python, engineer a handful of rolling-window features per well (amp deviation from a trailing baseline, temperature slope, vibration trend), and train a baseline classifier with scikit-learn — a gradient-boosted tree model is a reasonable starting point before reaching for anything more exotic like an LSTM. The goal of a first version isn’t perfect accuracy; it’s a ranked watchlist that gets a production engineer looking at the right five wells instead of scrolling through all of them.
For teams that want this operationalized rather than hand-built, platforms already built for oilfield time-series data — such as Corva for real-time well and workflow automation, or Cognite for contextualized industrial data at scale — provide the ingestion, tagging, and modeling scaffolding so the engineering team can focus on defining what “healthy” looks like for their wells rather than building a time-series pipeline from scratch. And for exploring a specific anomaly on the spot, tools like Claude or ChatGPT are increasingly used as a first-pass sounding board for interpreting an odd amp chart or drafting the feature logic before it gets coded into the pipeline proper.

The bookmark-worthy takeaway
ESP run life has always been a numbers game — average pumps run somewhere in the range of two to three years before failure, shorter in harsh wells, longer in gentle ones — and every operator already accepts that pumps will eventually come out of the hole. The shift AI brings isn’t magic failure immunity. It’s converting a chunk of those inevitable failures from surprises into scheduled events, using signals — motor current signature analysis, vibration deviation, SCADA telemetry — that the field was often already collecting and just wasn’t watching closely enough to act on in time.
If you’re building out the artificial lift side of this stack, it’s worth pairing ESP failure prediction with the surrounding tooling: sizing changes are easier to reason about with an ESP affinity laws calculator, and if your field runs a mixed fleet, the same predictive logic applies on the rod side — see our breakdown of AI dynamometer card diagnostics for rod pumps for the sucker-rod equivalent of this same amp-chart-to-model approach.
