
By Saad Iqbal
A heavy-oil well in a Lloydminster-style sand pad is making 118 barrels a day on a progressing cavity pump, same as it has for fourteen months. Then, over three weeks, the drive’s torque reading climbs about 9%. Nobody on the production team is watching it closely, because nobody has told the SCADA system what “climbing” means for this specific well. By the time a pumper notices the surface unit straining and calls it in, the stator has already taken damage that a rig and a new pump-down assembly will need to fix. The well is down for four days. Every other artificial lift method on this pad — the ESPs two pads over, the gas-lift wells down the road — has an AI model watching exactly this kind of drift. The PCP well didn’t.
The Lift Method AI Investment Skipped
Walk through what the industry has built AI around in the last three years and a pattern jumps out. ESP failure prediction reads motor current signature analysis and vibration data. Gas lift optimization closes the loop on injection setpoints. Rod lift gets dynamometer-card classification and pump-off controllers. Plunger lift gets cycle-timing models. Jet pumps, the quietest member of the family, still mostly run on manual tuning — a gap this site covered recently.
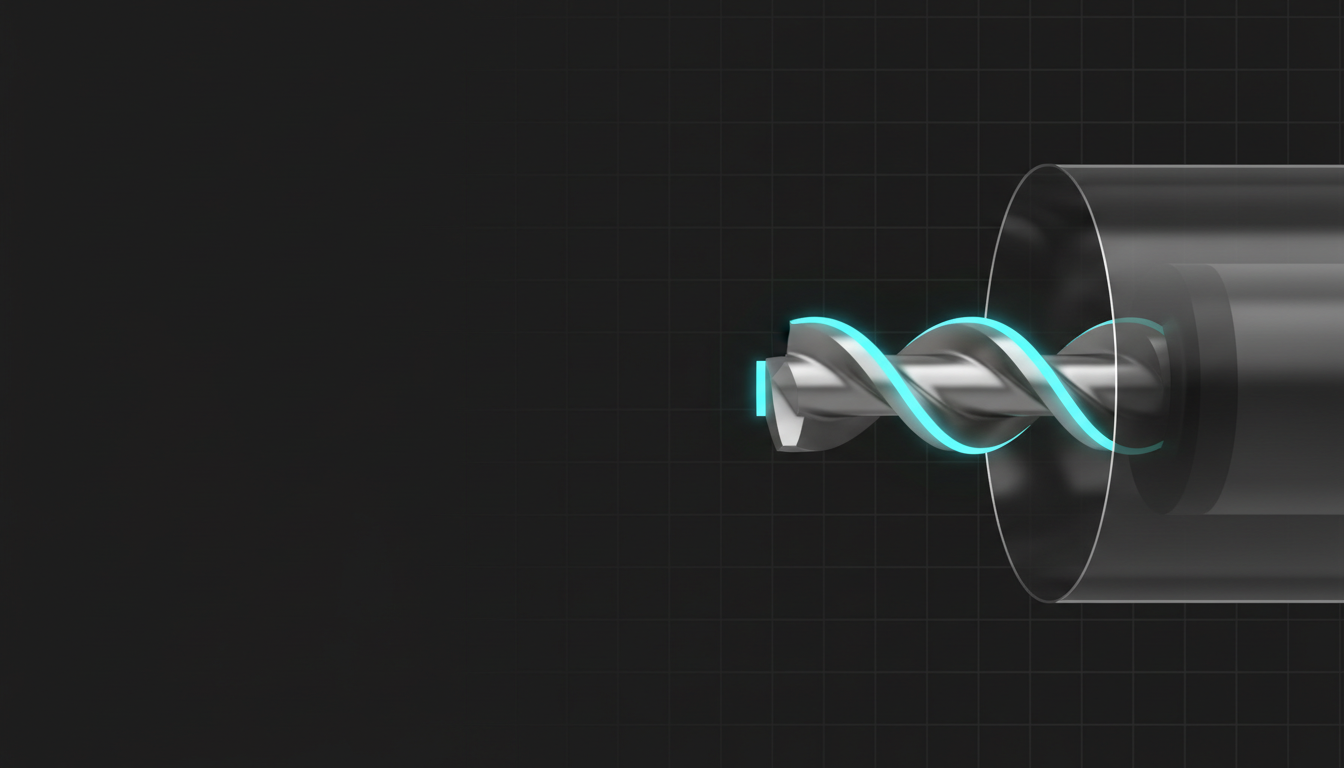
Progressive cavity pumps sit in a similar blind spot, and the reason is structural, not technical. A PCP has exactly one moving downhole part — a helical steel rotor turning inside an elastomer-lined stator, pushing fluid through a sequence of sealed cavities toward the surface. That simplicity is the whole sales pitch: no valves to gas-lock, no plunger to stick, tolerance for sand and viscous heavy oil that would choke a rod pump. But it’s also why PCP wells have historically relied on “it’s still making oil” as the monitoring strategy. There’s no dynamometer card. There’s no amp-draw signature everyone has standardized around like there is for ESPs. The signal that matters — torque and speed at the drive head, with flow rate as the output everyone actually cares about — has been sitting in the surface controller the entire time, mostly ignored.
What the Drive Is Actually Telling You
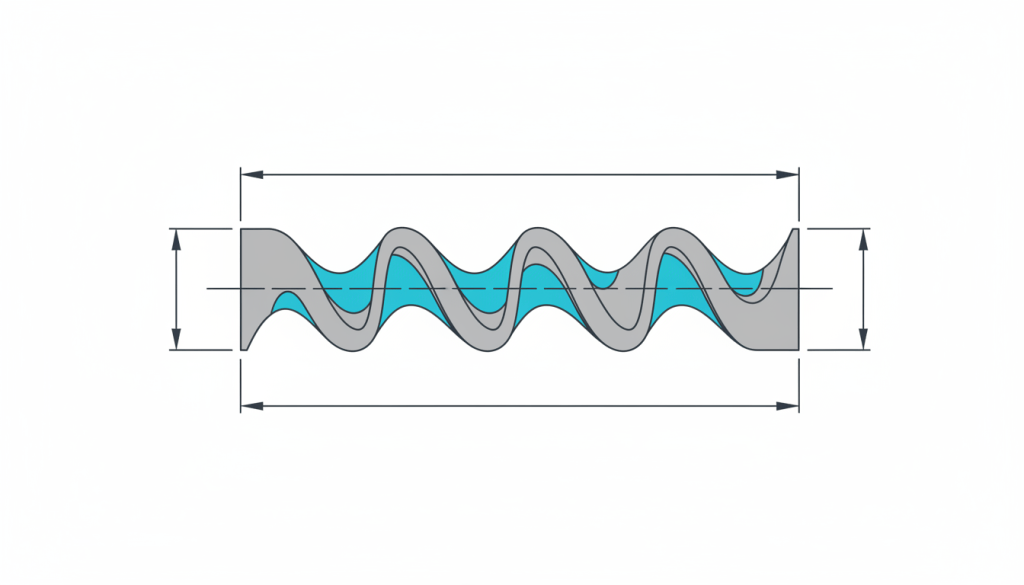
Start with the physics, because the AI signatures only make sense once you know what “normal” looks like. A PCP’s theoretical displacement per revolution follows a geometry-only relationship that production engineers have used since the pump was adapted from Rene Moineau’s 1930s screw-pump patent:
Vd = 4 · e · D · Ps
- Vd = theoretical displacement per revolution (mm³)
- e = eccentricity, the offset between the rotor’s centerline and the stator’s centerline (mm)
- D = rotor diameter (mm)
- Ps = stator pitch, the axial length of one complete cavity (mm)
Run a typical onshore heavy-oil geometry through it: e = 4 mm, D = 24 mm, Ps = 200 mm. That gives Vd = 4 × 4 × 24 × 200 = 76,800 mm³, or 0.0768 liters per revolution. At a drive speed of 200 rpm, theoretical displacement is 0.0768 × 200 = 15.36 L/min, which is 22.1 m³/day — about 139 bbl/day before any losses.
Actual production always lands below that number, and the gap is slip: fluid leaking backward through the clearance between rotor and stator under the pressure differential between cavities, instead of advancing toward surface. A well running at 85% volumetric efficiency on that same geometry makes roughly 118 bbl/day — the exact number our Lloydminster-style well opened with. Slip isn’t a flaw to fix; it’s a baseline to track. What AI monitoring does is watch how that efficiency — and the torque needed to turn the rotor against a given back-pressure — moves over time, because each failure mode moves it in a different, recognizable direction.
That baseline efficiency isn’t a fixed number from a catalog, either. Slip scales roughly with the pressure differential across the pump divided by fluid viscosity — thin, low-viscosity fluid at high differential pressure slips more than thick heavy oil at the same differential, because viscosity is doing part of the sealing job the elastomer clearance would otherwise have to do alone. That’s exactly why a fleet-wide “85% is normal” threshold is the wrong tool: a well making 15 cp fluid at 200 psi differential and a well making 800 cp fluid at the same differential have genuinely different healthy baselines, and comparing one against the other’s threshold produces false alarms in one direction and missed wear in the other.
Three Signatures, Three Different Failures
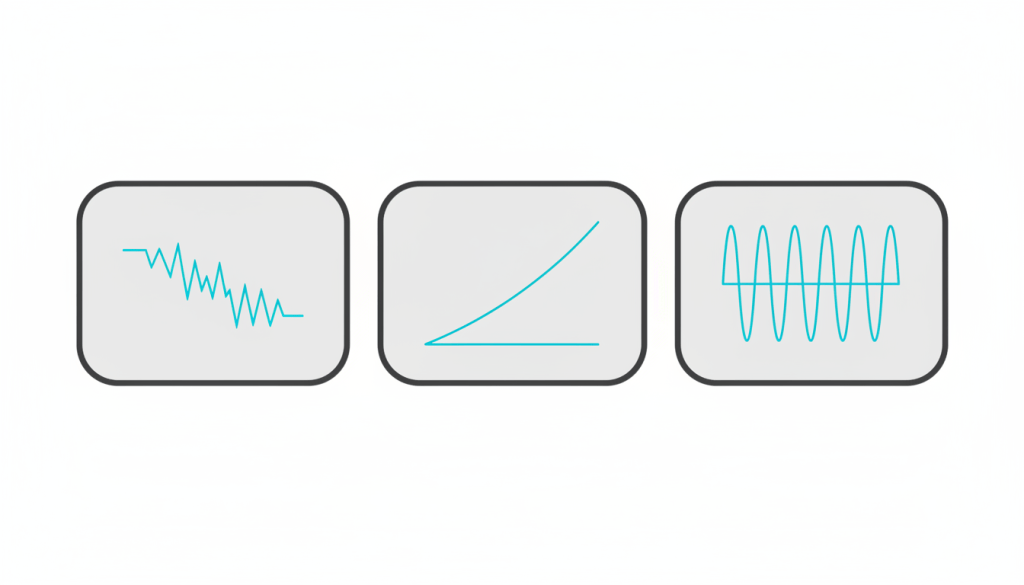
Vendors building PCP-specific monitoring, including iFactory AI’s PCP performance platform, describe the same three distinct patterns once you plot torque, speed and flow rate against each other instead of watching any one of them in isolation:
- Rotor-stator wear. A gradual, sustained decline in flow rate relative to speed, with torque trending slightly downward as the sealing clearance opens up. This is the slow, expected failure mode — abrasive heavy-oil sand or long run life eroding the elastomer or the rotor’s chrome plating. It shows up as volumetric efficiency quietly sliding from 85% toward 70% over months.
- Elastomer swelling. Torque rising faster than speed or flow would explain — the opposite shape from wear. This usually follows a change in produced-fluid composition, a temperature shift, or a workover that introduced new completion fluid the stator’s elastomer wasn’t rated for. Catch it early and a speed reduction buys time; miss it and the rotor can seize against a swollen stator bore.
- Gas interference. Intermittent, cyclical dips in flow that don’t correlate with torque or speed changes at all. Free gas entering the pump intake displaces liquid in the cavities without doing proportional work on the drive, so the signature is noisy and periodic rather than a clean trend — closer to the liquid-loading pattern gas wells show than to a mechanical wear curve.
The useful part is that none of these require a new downhole gauge. A variable-speed drive already logs torque, speed and, on most modern controllers, an estimated flow rate every few seconds. The AI’s job is comparing today’s torque-speed-flow relationship against that specific well’s own history — not some generic fleet average — because stator pitch, elastomer compound and fluid viscosity vary enough well to well that a fleet-wide threshold either misses real problems or drowns the pumper in false alarms.
Building the Baseline Yourself
You don’t need a vendor contract to start. If your drive controller exposes torque, speed and flow over Modbus or through a historian export, a per-well baseline is a weekend’s work in Python with pandas:
import pandas as pd

# df has columns: timestamp, torque_pct, speed_rpm, flow_bpd
df['volumetric_eff'] = df['flow_bpd'] / (df['speed_rpm'] * 0.0768 * 1440 / 158.987)
df['torque_per_rpm'] = df['torque_pct'] / df['speed_rpm']

baseline_eff = df['volumetric_eff'].rolling('30D', on='timestamp').median()
baseline_torque = df['torque_per_rpm'].rolling('30D', on='timestamp').median()

df['eff_drift_pct'] = (df['volumetric_eff'] - baseline_eff) / baseline_eff * 100
df['torque_drift_pct'] = (df['torque_per_rpm'] - baseline_torque) / baseline_torque * 100

# Falling efficiency + falling torque/rpm -> wear
# Rising torque/rpm with flat/rising efficiency -> swelling
# Cyclical efficiency swings with flat torque -> gas interference
alerts = df[(df['eff_drift_pct'].abs() > 10) | (df['torque_drift_pct'].abs() > 10)]
Feed the rolling baseline and drift columns into Power BI or Looker Studio and you have a per-well early-warning dashboard that costs nothing beyond the data you already collect. For the alert itself, a no-code flow in Make or Zapier watching that same alerts table can push a message straight to the pumper’s phone the morning a well first crosses the threshold, instead of waiting for the weekly report. It won’t diagnose a failure with the confidence of a vendor platform trained across thousands of wells, but it will turn a torque creep that used to go unnoticed for three weeks into a flag on day two or three — long enough to cut speed, schedule a workover on your terms, or confirm nothing’s actually wrong before a rig gets dispatched for nothing.

Where PCP Monitoring Goes From Here
PCPs will probably never get the AI attention ESPs or gas lift systems have, simply because there are fewer of them and the failure economics are smaller per well. But the same logic that made rod-lift dynamometer cards a standard diagnostic thirty years ago applies here: a mechanical system with a small number of sensors and a repeatable signature is exactly the kind of problem machine learning is good at, once someone bothers to build the baseline. For now, that’s mostly a handful of specialist vendors and operators willing to write their own rolling-median script. Pumps like ChampionX’s progressing cavity systems already expose the drive data that makes this possible — the monitoring layer on top is still catching up.
If you’re running PCP wells today, the fastest first step isn’t buying a platform — it’s exporting six months of torque, speed and flow history and plotting volumetric efficiency against time, well by well. You’ll likely find at least one well already drifting. For the production-engineering math behind the broader lift-performance picture, the sucker rod pump volumetric efficiency tutorial below walks through the same diagnostic logic applied to rod lift.
