

By Saad Iqbal
A pumper on a West Texas lease logs a well at 430 barrels a day off the test separator, pulls up the pump card specs, and frowns — the unit is rated to move more than 700 barrels a day at this stroke speed. Nothing on the surface looks wrong. No alarms, no visible leaks, the unit is running smooth and on time. But somewhere between the surface and the pump, almost 40% of the barrel the equipment should be moving is going missing. That gap has a name — sucker rod pump volumetric efficiency — and it’s one number that turns a vague “the well’s underperforming” into a specific, fixable diagnosis in about fifteen minutes of arithmetic.
What a Low Volumetric Efficiency Is Actually Telling You
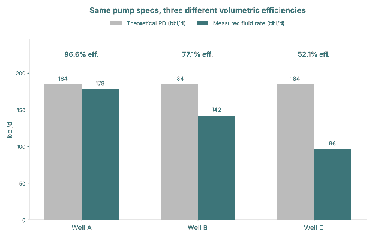
Every rod pump has a theoretical ceiling — the volume it would move per day if the plunger filled completely on every single upstroke, with zero slippage, zero gas, and a stroke exactly as long as the surface equipment indicates. No well pumps at 100% of that ceiling, and that’s fine; even a healthy, well-maintained installation usually settles between 70% and 85%. The number becomes a diagnostic the moment it drops meaningfully below that range, because the usual suspects are specific and actionable: free gas entering the pump chamber instead of liquid, a worn plunger or barrel letting fluid slip back past the seal on the upstroke, a leaking traveling or standing valve, or rod stretch quietly shortening the plunger’s effective travel versus what the surface stroke length implies. Chase the wrong one and you can spend a workover on a pump teardown when the real fix was a gas anchor, or vice versa — which is exactly why you calculate the number before you guess the cause.
Prerequisites
- Plunger diameter (in) from the pump’s API designation tag or completion report.
- Surface stroke length (in) from the pumping unit’s nameplate or geometry sheet.
- Pumping speed in strokes per minute (SPM), from the unit’s current timer setting or a stopwatch count.
- A metered or well-test total liquid rate (bopd) — total liquid, not just oil, since the pump displaces whatever fluid arrives at the intake.
- Python 3 (no libraries required) or a spreadsheet, to automate once you’ve done it by hand once.
Worked example used throughout: a 2.0-inch plunger, an 86-inch surface stroke length, pumping at 18 SPM, with a recent well test showing 430 bbl/day total liquid.
Step 1 — Gather Clean Well and Pump Data
Volumetric efficiency is only as trustworthy as the three numbers that build the theoretical rate, so confirm each one against a primary source rather than a dispatcher’s memory. Plunger diameter should come off the pump’s actual API designation (for example, a 25-175-RHAC-style tag), not an assumption based on tubing size. Stroke length is the surface polished-rod stroke, measured or read off the unit geometry — not the pump’s true downhole stroke, which rod stretch will shorten; that distinction comes back in the pitfalls section. SPM should be read live off the unit, since a drive sheave change or a pump-off controller cycling the well will make the nameplate SPM wrong without anyone updating the file.
Why it matters: every one of these three numbers gets squared or multiplied straight through to the final efficiency figure. A stroke length that’s 10% off doesn’t cause a 10% error in your diagnosis — because of how the pump displacement equation compounds diameter, stroke, and speed together, small input errors routinely produce efficiency numbers that are wrong by 15–20 percentage points, enough to send you chasing the wrong failure.

Step 2 — Calculate Theoretical Pump Displacement
The standard field equation for theoretical rod pump displacement, PD, converts plunger diameter, stroke length, and pumping speed directly into barrels per day:
PD (bbl/day) = 0.1166 × D² × S × N
where D is plunger diameter in inches, S is surface stroke length in inches, and N is pumping speed in strokes per minute. The 0.1166 constant folds together the plunger’s cross-sectional area, the inch-to-barrel unit conversion, and the 1,440 minutes in a day, so the equation works directly on field units with no intermediate conversion needed.
PD = 0.1166 × (2.0)² × 86 × 18 = 0.1166 × 4 × 86 × 18 = 722 bbl/day.
Why it matters: this is the ceiling the well is being measured against, and it assumes the plunger fills completely and travels the full surface stroke every single cycle — an idealized number by design, which is exactly why the comparison in Step 3 is informative rather than circular.
Step 3 — Compare the Metered Rate to Find Volumetric Efficiency
With the theoretical ceiling in hand, volumetric efficiency is simply the metered total liquid rate divided by that ceiling:
Ev (%) = (qactual / PD) × 100
Ev = (430 / 722) × 100 = 59.6%.
That’s meaningfully below the healthy 70–85% band, and the gap — roughly 40% of theoretical displacement unaccounted for — is large enough to rule out ordinary measurement noise. A result in this range points toward one or more of: free gas entering the barrel on the upstroke (gas interference), a worn plunger-and-barrel fit allowing backflow, or a leaking traveling or standing valve letting fluid slip past on every stroke.
Why it matters: this single ratio is what turns “the well feels like it’s underproducing” into a number you can trend well-over-well and month-over-month — a slow decline in Ev on an otherwise stable well is one of the earliest tells that a pump is wearing out, often weeks before a dynamometer card shows it clearly.

Step 4 — Diagnose the Cause and Automate the Check
A single low reading tells you something is wrong; a trend tells you what. If Ev has been sliding gradually over weeks with no change in surface parameters, suspect mechanical wear — a plunger and barrel losing their fit over time. If it dropped suddenly after a workover or a change in producing rate, suspect gas interference, especially on a well without a working gas anchor. A dynamometer card from a tool like Echometer‘s well analyzer will usually confirm which one it is directly, by showing you the load-versus-position loop shape rather than just the summary number — rounded, compressed cards point to gas, while a sharp load-transfer shift points to a valve. Fleet-wide platforms such as Ambyint run this same volumetric-efficiency check continuously across hundreds of wells and flag the ones drifting out of range automatically, which is the practical reason to script the calculation rather than running it well-by-well in a spreadsheet:
def rod_pump_volumetric_efficiency(plunger_in, stroke_in, spm, q_actual_bopd):
    """Return theoretical displacement (bbl/day) and volumetric efficiency (%)."""
    pd_bbl_day = 0.1166 * plunger_in ** 2 * stroke_in * spm
    ev_pct = (q_actual_bopd / pd_bbl_day) * 100

    if ev_pct >= 85:
        flag = "check for over-displacement / unit oversized"
    elif ev_pct >= 70:
        flag = "normal range"
    elif ev_pct >= 55:
        flag = "watch: possible gas interference or early wear"
    else:
        flag = "investigate: gas interference, worn pump, or valve leak"

    return {
        "theoretical_bbl_day": round(pd_bbl_day, 1),
        "volumetric_efficiency_pct": round(ev_pct, 1),
        "flag": flag,
    }

well_12 = rod_pump_volumetric_efficiency(
    plunger_in=2.0, stroke_in=86, spm=18, q_actual_bopd=430
)
print(well_12)
# {'theoretical_bbl_day': 722.0, 'volumetric_efficiency_pct': 59.6,
#  'flag': 'investigate: gas interference, worn pump, or valve leak'}
Loop that function over a CSV of every well on the lease — plunger size, stroke, SPM, and last well-test rate — and you get a ranked list of the wells most worth a field visit this week, instead of waiting for someone to notice a well “feels low.”
Expected Result, Sanity Check, and Pitfalls
For this worked example, expect a theoretical displacement of 722 bbl/day and a volumetric efficiency of 59.6% — low enough to justify a dynamometer card or a gas anchor inspection before the next workover budget cycle. Sanity-check the result two ways: confirm PD against a second method (a rod pump design handbook table or your pump vendor’s rating) before trusting a hand calculation, and confirm the metered rate is total liquid, not oil-only — using an oil-only rate on a well with meaningful water cut will understate Ev and point you at a problem that isn’t there.
- Using nameplate stroke length instead of actual downhole stroke. Rod stretch under load shortens the plunger’s true travel versus the surface polished-rod stroke; on deep or high-load wells this alone can account for several efficiency points, so treat a borderline result as a flag to check rod stretch before condemning the pump.
- Using oil rate instead of total liquid rate. The pump doesn’t know the difference between oil and water — it displaces whatever fluid is at the intake, so the efficiency calculation needs the gross liquid rate to mean anything.
- Treating one low reading as proof of pump failure. A single depressed Ev can be a well test artifact, a temporary gas slug, or a pump-off controller cycle caught mid-stroke-rate change — confirm with a second test or a dynamometer card before scheduling a workover.
If this well also runs electrical submersible pumps elsewhere on the lease, the ESP TDH calculation tutorial covers the equivalent sizing check for that lift method, and if the dynamometer card itself is the better diagnostic for a specific well, AI dynamometer card diagnostics for rod pumps picks up exactly where this volumetric efficiency check leaves off.
