
By Saad Iqbal
The first sign is never dramatic. A choke that used to hold steady for six months starts drifting open every few weeks. A production engineer pulls the trend, shrugs, and books a workover for “erosion, probably.” Three months later the same well kicks off an unplanned shut-in because a screen finally let go and sand cut clean through a flowline elbow. Nobody saw a single spike coming — because nobody was watching the right signal, at the right resolution, in real time. That is the gap AI sand production monitoring tools exist to close, and it is a genuinely solvable problem in 2026.
This post is a working shortlist: the real, currently available AI and automation tools upstream teams are using to detect sand production early, cut false alarms, and protect chokes, screens, and flowlines before the next unplanned shut-in. No hype, no invented products — every tool below is verifiable and linked to its official page.
Why Sand Production Still Catches Upstream Teams Off Guard
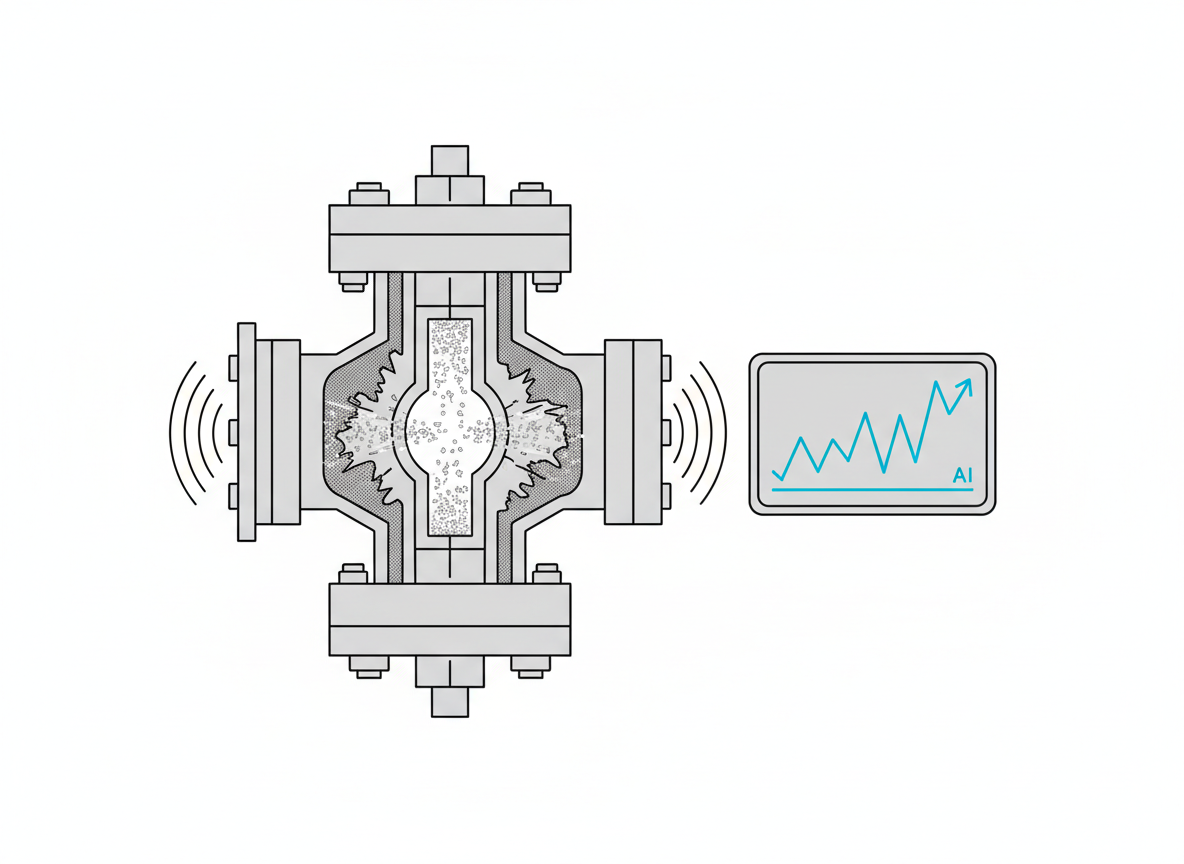
Sand production is rarely a mystery in principle. Weakly consolidated formations, high drawdown, water breakthrough, and aggressive choke changes all push a well past its critical drawdown pressure, and formation sand starts moving with the fluid stream. What is hard is timing. Erosion from sand-laden flow is a cumulative, nonlinear process — a choke bean can look fine for weeks and then lose most of its remaining wall thickness in days once a threshold is crossed. By the time a manual round of readings shows a problem, the erosion curve has usually already bent upward.
The traditional instrumentation — acoustic sand detectors clamped onto the pipe, or periodic sand-content spot checks — has always produced a signal. The limitation was never the sensor; it was turning a noisy acoustic waveform into a trustworthy sand rate, continuously, without a technician staring at a screen. That is exactly the kind of pattern-recognition problem machine learning is good at, and it is why sand monitoring has become one of the more mature applications of AI in upstream production.
What “AI-Powered” Actually Means for Sand Monitoring
Strip away the marketing and there are really three layers doing the work:
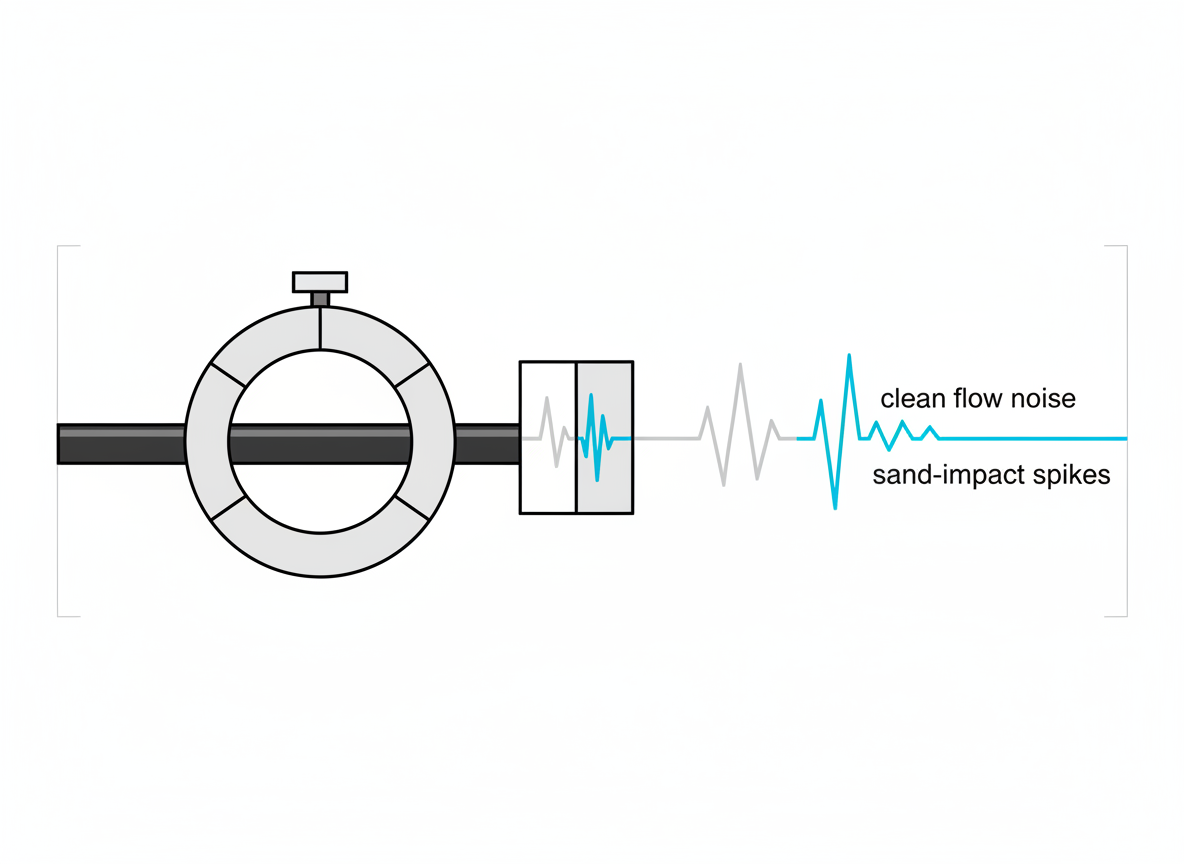
- Sensing. Clamp-on acoustic sand detectors (a piezoelectric ring around the pipe) or distributed acoustic sensing (DAS) fiber pick up the high-frequency impact energy of sand particles hitting the pipe wall.
- Classification. A trained model separates true sand-impact events from flow noise, multiphase turbulence, and mechanical vibration — the step that used to require a specialist eyeballing a waveform.
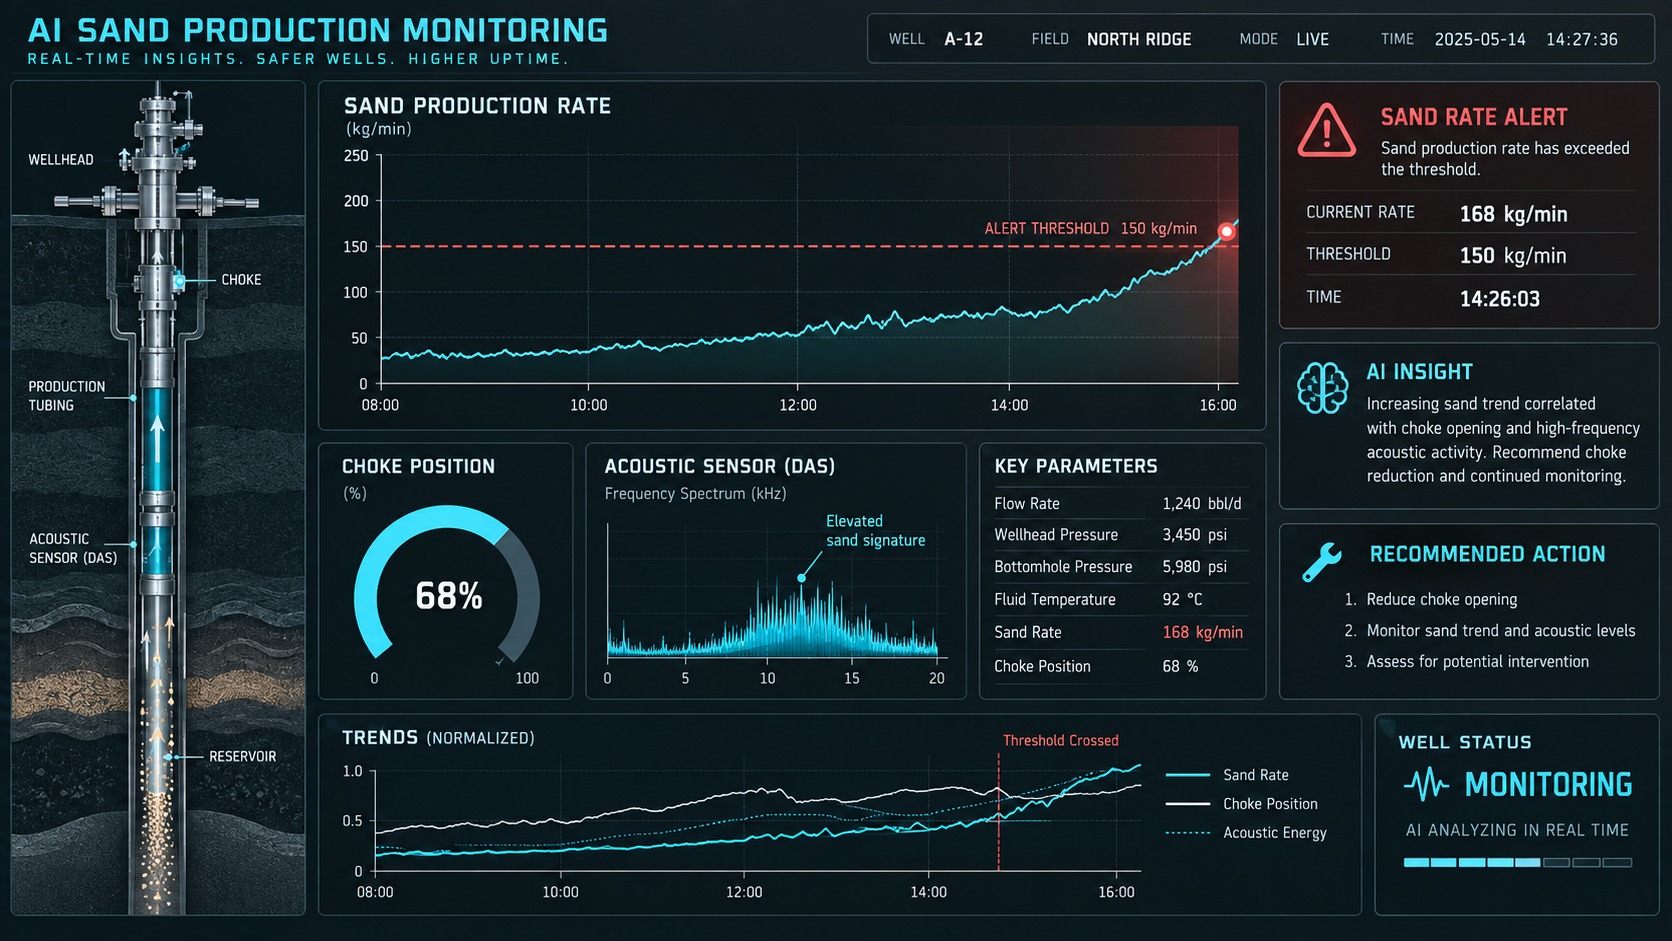
- Decisioning. The classified rate gets compared against a rolling baseline and an engineering threshold (often tied to an erosional velocity or API RP 14E-style limit), and the system raises an alert, throttles a choke recommendation, or logs a trend for the next production meeting.
Research groups have been publishing acoustic sand-rate models using neural networks and improved signal-decomposition techniques for exactly this reason: raw acoustic energy alone is a poor sand-rate predictor once multiphase flow is involved, and a trained model closes that gap meaningfully better than a fixed calibration curve.
The Best AI & Automation Tools for Sand Production Monitoring in 2026
This list runs from purpose-built hardware-plus-software systems down to the general-purpose layer most teams still assemble by hand.
1. Roxar SAM Acoustic Sand Monitor (Emerson)
The Roxar SAM Acoustic Sand Monitor is the instrument most upstream engineers picture when they hear “sand detector.” It is a clamp-on, non-intrusive acoustic sensor that has been the field-proven backbone of topside and subsea sand monitoring for years, and the newer processing behind it applies pattern-based signal analysis to separate genuine sand impacts from flow noise across a wide turndown range — from a few grams per day up to full sand-production events. If you need one instrument that a completions and a production team will both trust, this is the reference point.
2. Distributed Acoustic Sensing (DAS) Sand Analytics
Where a well already runs fiber for flow or leak diagnostics, DAS-based sand detection is increasingly viable: published field studies have shown DAS-derived variable spectral density signatures can pick out sand transport events along the wellbore, not just at a single clamp point. The advantage is spatial — you get a sense of where along the completion sand is entering, which acoustic clamp-on sensors alone cannot tell you. The tradeoff is that DAS sand analytics still leans on custom model-building per field, so budget engineering time alongside the fiber investment.
3. Python + pandas for Custom Sand-Rate Alarming
Most vendor systems will hand you a historian tag or a CSV export of classified sand rate. What happens next — rolling baselines, threshold logic, and shift-handover alerts — is where a lot of teams end up writing their own thin layer in Python with pandas. It does not need to be complicated. A rolling-median baseline with a standard-deviation trigger catches the “quietly climbing” pattern that a single fixed threshold misses:
import pandas as pd

# sand_rate_g_per_day: time-indexed Series of classified sand rate
baseline = sand_rate_g_per_day.rolling("7D").median()
spread = sand_rate_g_per_day.rolling("7D").std()

alert_threshold = baseline + 3 * spread
alarms = sand_rate_g_per_day[sand_rate_g_per_day > alert_threshold]

print(f"{len(alarms)} sand-rate excursions flagged above rolling baseline")
It is a few lines, but it turns a noisy daily number into a trend a duty engineer can act on before a screen fails, not after.
4. Power BI or Looker Studio for the Multi-Well Rollup
A single well’s sand trend is useful; a field-wide view of which wells are approaching threshold is what actually changes a workover schedule. Microsoft Power BI and Google Looker Studio both connect to a historian export or a database and turn classified sand-rate data into a ranked “which wells need attention this week” dashboard — the artifact that actually gets discussed in the Monday production meeting.
5. ChatGPT or Claude for Alarm Triage and Intervention Write-Ups
Once a well trips a sand-rate alarm, someone still has to decide what to do and write it up for the next shift. ChatGPT and Claude are useful in the unglamorous middle step: paste in the alarm history, the last choke change, and the well’s completion type, and ask for a first-pass summary of likely cause and a draft intervention recommendation. It does not replace the production engineer’s judgment — it removes the fifteen minutes of formatting a handover note so that judgment gets applied faster.
How Do You Choose an AI Sand Monitoring Tool for Your Field?
Three questions narrow the field fast:
- Do you need a point measurement or a distributed one? A clamp-on acoustic monitor like Roxar SAM is the right default for most completions. Reach for DAS-based analytics only if you already have fiber in the hole and need to localize sand entry along a long lateral.
- Who owns the alarm logic? If your team wants full control over thresholds and rollups, budget for the Python-plus-dashboard layer. If you want a vendor-supported turnkey alarm, weigh that against the flexibility you give up.
- Will the output actually reach the person who acts on it? A sensor with no dashboard and no alerting habit is a sensor nobody looks at. Build the last mile — the Monday rollup, the shift-handover summary — with the same care as the sensing layer.

Common Pitfalls Teams Hit Without This Instrumented
- Treating erosion as linear. A choke that has looked stable for months can fail within days once critical velocity is crossed — see our related deep dive on how machine learning predicts sand production before it starts for the physics behind that curve.
- One threshold for every well. A fixed sand-rate alarm ignores that unconsolidated wells and consolidated wells have entirely different baselines; a rolling, well-specific baseline (as in the Python example above) is what actually cuts false alarms.
- No link back to production data. Sand rate divorced from choke position, drawdown, and water cut tells you *that* something changed, not *why*. Pull it into the same view as your broader production data analytics stack rather than a standalone screen.
The Bottom Line
None of these tools are exotic, and none of them require a data science team to stand up. A clamp-on acoustic monitor, a rolling-baseline script, and a dashboard that someone actually opens on Monday morning will catch the vast majority of sand production problems before they become a choke replacement or an unplanned shut-in. If you want to go one layer deeper on the physics behind the alarm threshold, our tutorial on automating the erosional velocity check walks through the API RP 14E calculation the alarm logic above is ultimately protecting.
