
By Saad Iqbal
Every rod pump well is quietly writing its own medical chart, once per stroke, and most of the time nobody’s reading it until something’s already broken. A pumper walks the lease, glances at a controller screen, maybe pulls a card if production looks off — and by the time a fluid pound or a gas-locked pump gets flagged manually, the well may have been fighting itself for weeks, wearing rods, sanding up the barrel, or simply pumping air. AI dynacard diagnostics is what changes that: instead of a human eyeballing a card once in a while, a model reads every single stroke’s dynamometer card as it’s recorded and tells you, in near real time, exactly which of a dozen-plus failure modes is developing.
The underlying diagnostic method — reading the shape of a load-versus-position card — is decades old and taught in every artificial lift course. What’s changed is who’s doing the reading, and how many cards they can look at per second.
What a Dynamometer Card Actually Shows
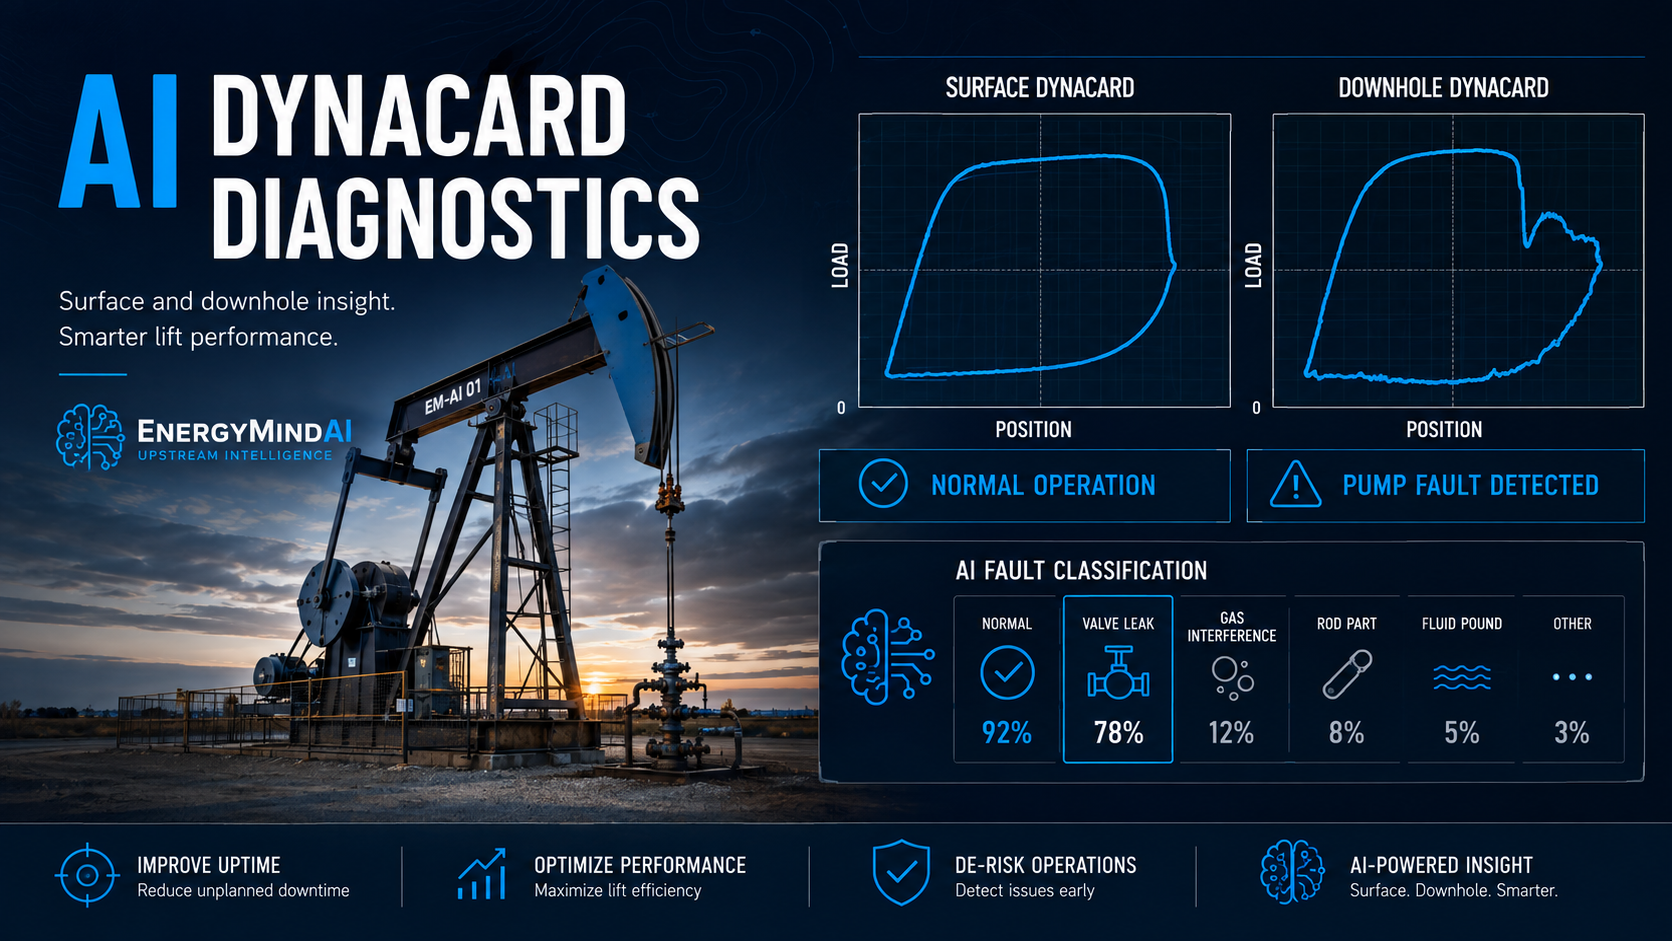
A surface dynamometer records polished rod load against plunger position through one full stroke, up and down. Plot the two against each other and you get a closed loop — the “card” — whose shape encodes exactly what’s happening downhole: when the traveling valve opens, when the standing valve opens, how much load the rod string carries on the upstroke versus how much it sheds on the downstroke. A healthy pump traces a clean, roughly rectangular loop with sharp corners where the valves open. Every failure mode distorts that shape in a specific, repeatable way.

Walk the loop clockwise and the story reads like this: on the upstroke, the traveling valve closes almost immediately as the rod string picks up the full weight of the fluid column, and load climbs to its peak; near the top, the standing valve opens as the plunger reaches the top of its travel and fluid is drawn into the barrel below it; on the downstroke, load sheds as the traveling valve opens and the plunger displaces fluid up the tubing, until the standing valve closes again near the bottom and the cycle repeats. Every one of those four transitions has a position on the stroke where it should happen — and every failure mode above is really just one of those transitions happening late, early, softly, or not at all.
That’s the theory every artificial lift engineer learns. In practice, reading cards by eye at scale doesn’t work — a mid-size operator running a few hundred rod pump wells generates tens of thousands of cards a day, and a pumper can review maybe a few dozen closely before the shift ends.
Four Card Shapes Worth Knowing
Most of the value in dynacard diagnostics comes from recognizing a handful of recurring distortions:
- Gas interference — the card caves in on the upstroke corner as trapped gas compresses before the traveling valve fully opens, softening what should be a sharp transition.
- Fluid pound — a sharp vertical drop appears near the bottom of the stroke as the plunger free-falls through gas or vapor before hitting liquid, a classic sign the pump is running faster than the well can fill it.
- Worn pump or a leaking traveling valve — the loop thins and tilts, losing load differential between upstroke and downstroke because fluid is bypassing the plunger instead of being lifted.
- Deep rod part — load collapses toward zero for the remainder of the stroke the instant the break happens, an unmistakable and urgent signature.

Commercial systems built specifically for this — Ambyint’s Cognitive Card Recognition among them — classify against a longer list, on the order of a dozen or more distinct conditions, from stuffing-box friction to paraffin buildup to a stuck standing valve, each with its own recognizable card signature.
How Machine Learning Reads a Card Faster Than a Human Ever Could
The academic groundwork here is solid: published work on automatic dynamometer card recognition — including a widely cited approach using transfer learning combined with support vector machines — has demonstrated that a card’s shape can be reliably classified into normal and non-normal working conditions using pattern-recognition techniques trained on large sets of expert-labeled cards, rather than a fixed set of hand-coded rules. Different implementations lean on different techniques — support vector machines on hand-engineered shape features, convolutional networks trained directly on the card image, or a hybrid of both — but the common thread is the same: enough correctly labeled historical cards, for enough failure modes, teaches the model the same visual pattern-matching an experienced artificial lift engineer already does by eye, just applied to every stroke instead of an occasional sample.
In production, Ambyint’s InfinityRL platform runs this at scale: its Cognitive Card Recognition models were trained on millions of expert-labeled dynacards and classify against 14 distinct pump conditions, with reported model accuracy of 85% or higher — and closer to 95% for several of the more common conditions. The practical payoff isn’t just the classification itself: because the model evaluates every stroke instead of a periodic manual sample, it surfaces developing problems weeks or even months before a manual card pull would have caught them.

Building a Simple Card Feature Extractor Yourself
You don’t need millions of labeled cards to get started — a useful first pass is turning the raw load/position stroke data into a handful of engineered features a classifier (or even simple threshold rules) can act on. The area enclosed by the card, for instance, is the polished-rod work done per stroke, and it’s a cheap, powerful signal on its own:
import numpy as np

def card_work_area(position_in, load_lbf):
    """
    Polished-rod work per stroke, via the shoelace formula on the closed
    load-vs-position loop. position_in and load_lbf are arrays tracing one
    full stroke (up and down), in inches and lbf.
    Returns work in in-lbf (divide by 12 for ft-lbf).
    """
    x = np.asarray(position_in)
    y = np.asarray(load_lbf)
    return 0.5 * np.abs(np.dot(x, np.roll(y, 1)) - np.dot(y, np.roll(x, 1)))

def peak_to_peak_load(load_lbf):
    return max(load_lbf) - min(load_lbf)

# card_area and load swing become two of the input features to a
# classifier (or simple rule set) that flags fluid pound, gas
# interference, or a worn pump against a rolling baseline per well.
Feed a rolling window of these features — card area, peak-to-peak load, and the position at which load starts dropping on the upstroke — into pandas, flag deviations from each well’s own baseline, and you have a lightweight early-warning layer before you ever need a trained image classifier looking at the card shape itself.
Where This Fits in an Artificial Lift Program
Dynacard diagnostics rarely stands alone — it’s one signal among several an artificial lift engineer is already tracking:
- Pair it with production trends. A card showing gas interference alongside a rising trend from your water cut prediction model often points to the same changing inflow profile.
- Don’t stop at rod pumps. If the well’s on ESP instead, the equivalent early-warning signal comes from motor amps and vibration trends — see our piece on AI ESP failure prediction.
- Automate the surrounding calculations too. If you’re sizing or troubleshooting the lift system itself, our ESP affinity laws calculator in Python tutorial follows the same automate-the-formula approach used above.
- Commercial platforms handle the heavy lifting. Beyond Ambyint, ChampionX’s XSPOC is another widely deployed production-optimization platform with card-based diagnostics built in — worth evaluating if you’re choosing a platform rather than building your own classifier.
What Good Looks Like, and Where It Breaks
A working dynacard diagnostics pipeline should classify essentially every stroke, flag a change from a well’s own established baseline (not a generic fleet-wide threshold), and give you a lead time measured in weeks rather than the days-to-months lag of manual card pulls. To verify it’s actually working, pull a handful of historical cards you already know the outcome for — a rod part, a known fluid pound event — and confirm the classifier would have flagged them well before the failure was called on location.
A few common pitfalls: first, “bad data” is its own card category for a reason — a loose load cell or a slipping position sensor produces distorted cards that look pathological but aren’t, so any pipeline needs a data-quality check before the diagnostic classification, not after. Second, a classifier trained on one artificial lift design (conventional beam pump) won’t transfer cleanly to a different one (long-stroke or hydraulic units) without retraining — card shapes are geometry-dependent. Third, don’t chase 100% automation on day one: start by validating the model’s flags against a pumper’s judgment on a handful of wells before trusting it fleet-wide.
The card itself hasn’t changed since the first dynamometer was strapped to a polished rod. What’s changed is that something can finally read every single one of them, every single stroke, and tell you what’s wrong before it becomes a workover.
