
Download EnergyMindAI ESP Failure Prediction Studio
Try the Windows desktop tool alongside this article: import ESP telemetry CSVs, explore eight failure-mode screening hypotheses, view health trends and planning forecasts, and export PDF, Word and CSV reports. Your telemetry stays on your computer.
Download ESP Studio v1.0.0 for Windows (ZIP, 40 MB)
Getting started: Extract the ZIP, open EnergyMindAI-ESP-Failure-Prediction-Studio.exe, then select Load demo. No Python installation is required. The interface opens locally in your browser. Includes a 30-day trial; continued use requires authorization.
This download is the September 2, 2026 v1.0.0 release. Later development changes are not included. It provides engineering screening and decision support; scores are not validated failure probabilities and forecasts are not guaranteed failure dates. Review results against OEM limits and field evidence.
By Saad Iqbal
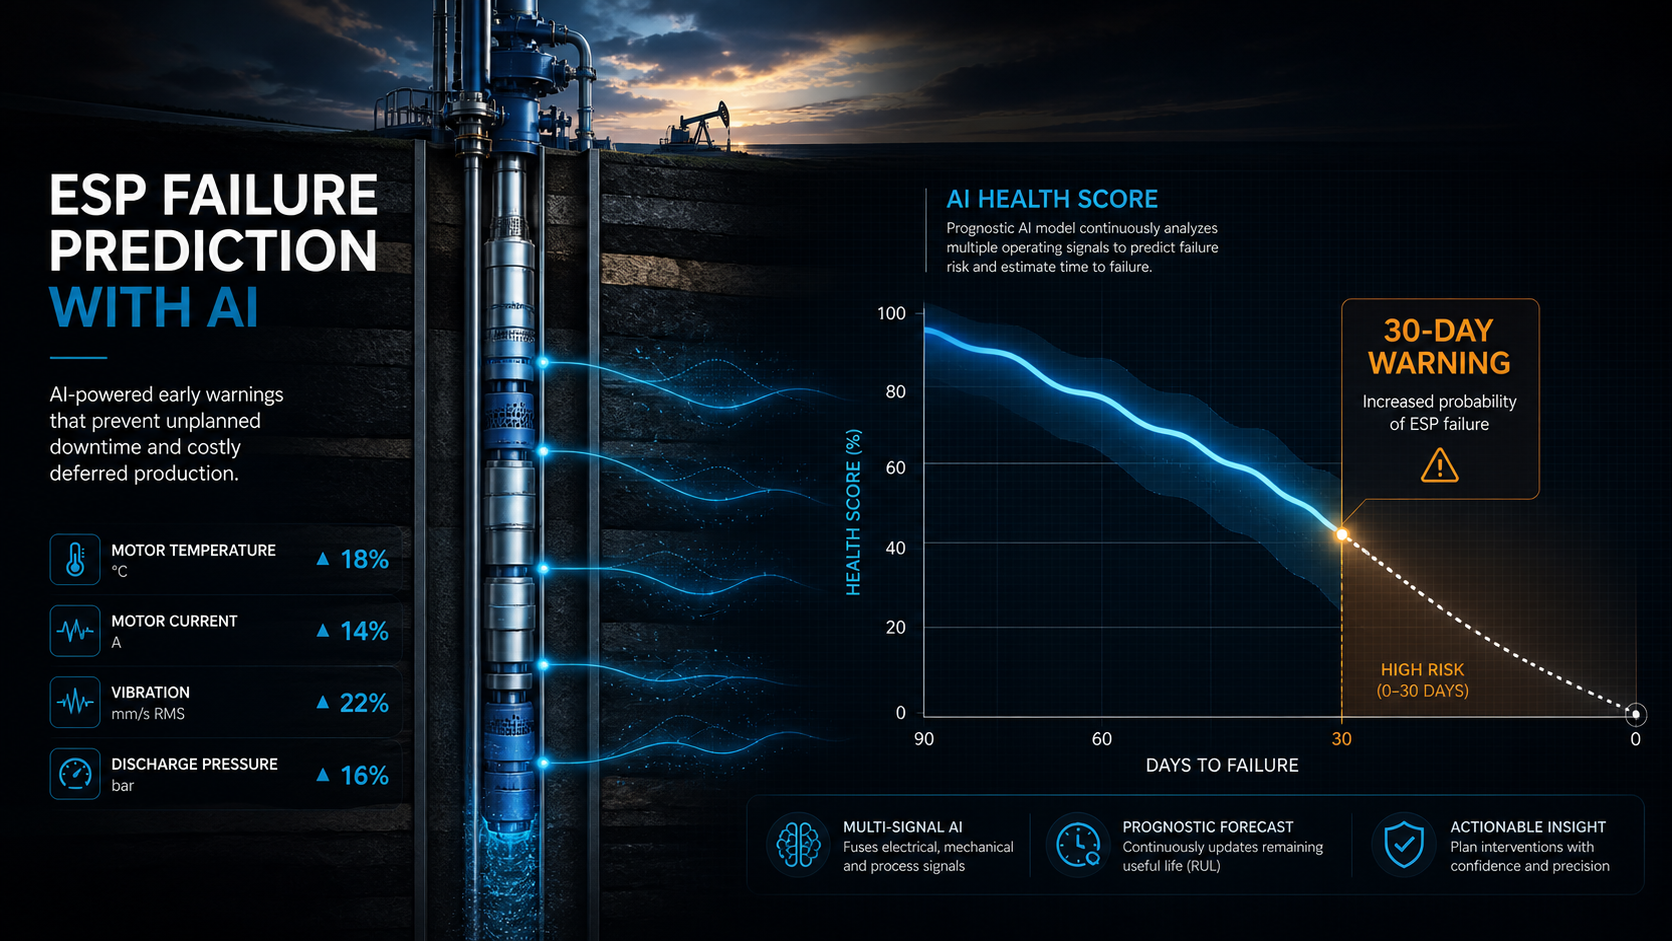
The call always comes at a bad hour. Production drops off a cliff on a well that was making steady barrels an hour ago, the pumper confirms it on the SCADA trend, and now there’s a workover rig to schedule, a rental pump to source, and a production forecast that just got a hole punched in it. Electrical submersible pumps fail on their own schedule, not yours — and by the time the failure shows up as zero flow, the actual damage (a burnt motor winding, a worn-through cable, a gas-locked stage) has usually been building for weeks.
Roughly a quarter of the world’s producing oil wells run on ESPs, which makes this one of the highest-value places in upstream operations to apply predictive maintenance — and the sensor data needed to do it is already sitting in your VSD and downhole gauge logs.
Why Run-to-Failure Is So Expensive
An unplanned ESP pull typically runs $150,000–$500,000 once you account for the workover rig, a rental pump, and the crew — before counting deferred production, which can add another $500–$2,000 a day depending on the well. Industry reports on predictive-maintenance programs put the annual loss from unplanned ESP failures at a 100-well field with a 50% failure rate over 18 months in the tens of millions of dollars. That’s the gap predictive maintenance is trying to close: not eliminating failures, but converting unplanned ones into planned ones.
Eight Signals, One Health Score
The models built for this don’t need exotic new instrumentation. A published study training decision tree and k-nearest neighbor classifiers on ESP failure data used eight parameters already available from any modern VSD and downhole gauge package:
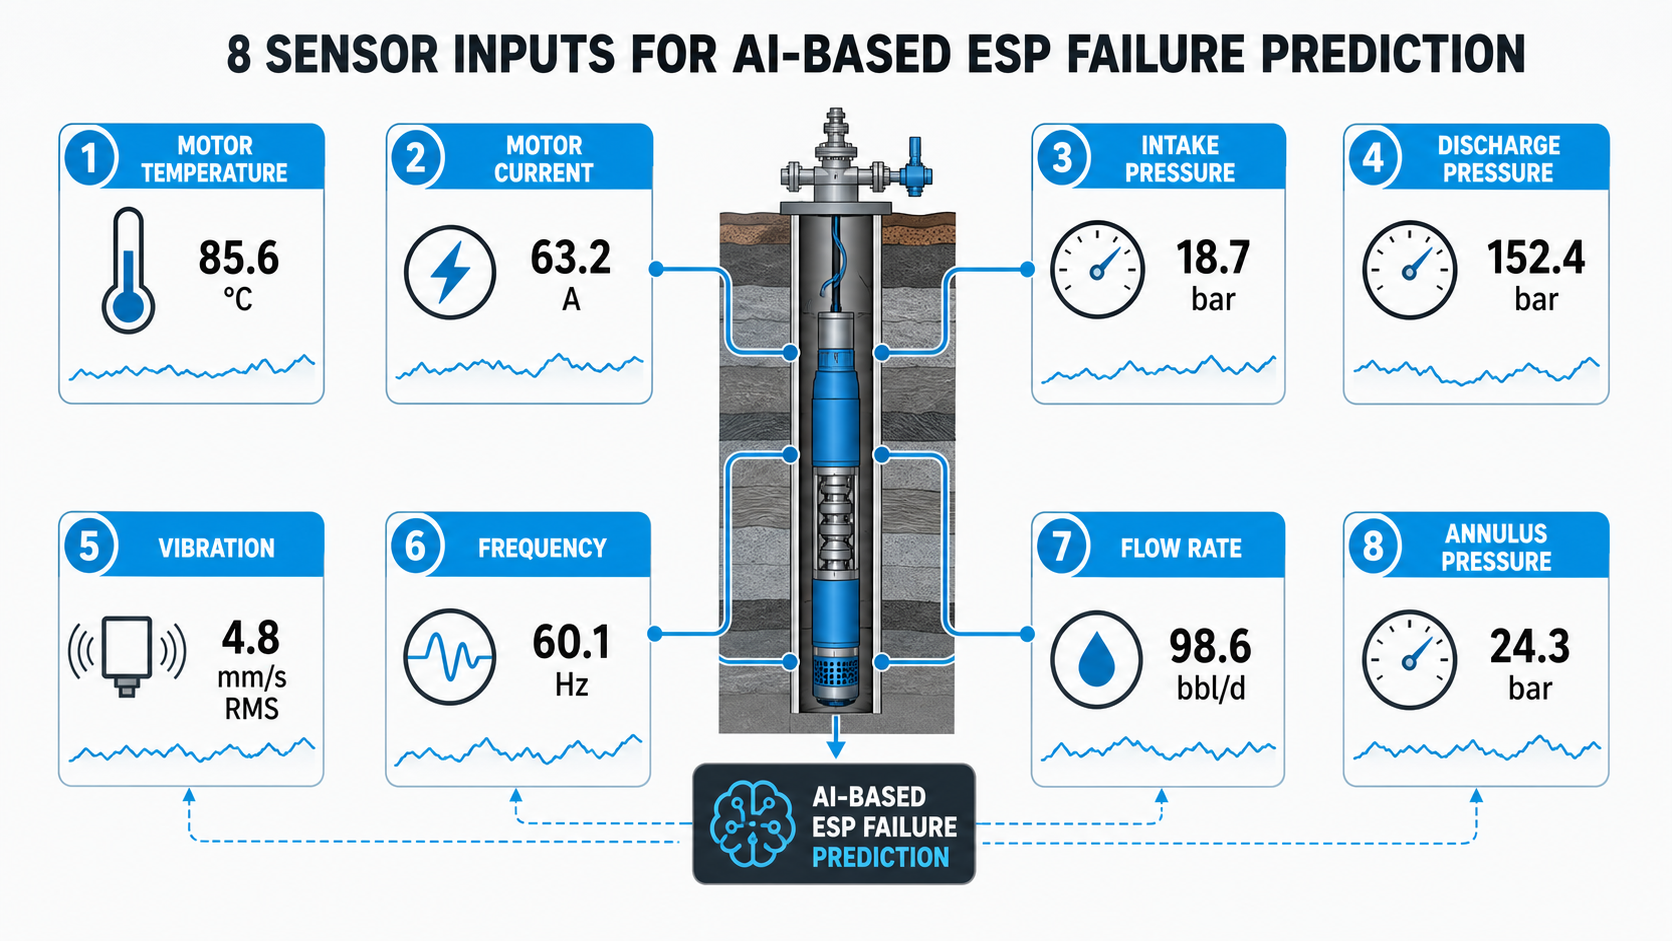
- Motor amperage
- Frequency (Hz)
- Pump intake pressure
- Motor temperature
- Output voltage
- Pump discharge pressure
- Input voltage
- Motor horsepower
Trained on data from 77 wells over two years — millions of individual readings — the classifiers reached better than 90% accuracy predicting which of eight distinct failure types a given pump was heading toward: motor insulation breakdown, impeller erosion, cable faults, gas lock, and others. That’s a meaningfully different output than a generic “pump health: 62%” gauge. Knowing the failure mode in advance changes what you order for the workover and how you plan it.
How the Model Actually Learns to See It Coming
Each failure mode leaves a distinct fingerprint in the sensor data well before the pump actually trips off. Industry deployments of this approach report the following lead-time patterns, which is why a single “health score” threshold isn’t enough — the model has to weight signals differently per failure type:
- Motor insulation breakdown — roughly 85% of cases show a temperature anomaly precedes the fault, giving days of warning.
- Impeller erosion — about 72% of erosion events are detectable through a shift in vibration signature before performance visibly degrades.
- Cable faults — roughly 68% show a current imbalance up to 30 days before the fault trips the drive.
- Gas lock / slugging — about 55% are predictable roughly 48 hours ahead from intake pressure and current oscillation patterns.
None of those percentages are 100%, and that’s an honest limitation worth stating plainly: this is a risk-reduction tool, not a guarantee. But catching two-thirds to five-sixths of your failure modes with real lead time is still a dramatically different maintenance posture than finding out when the well goes to zero.
The Economics: Why Operators Are Building This Anyway
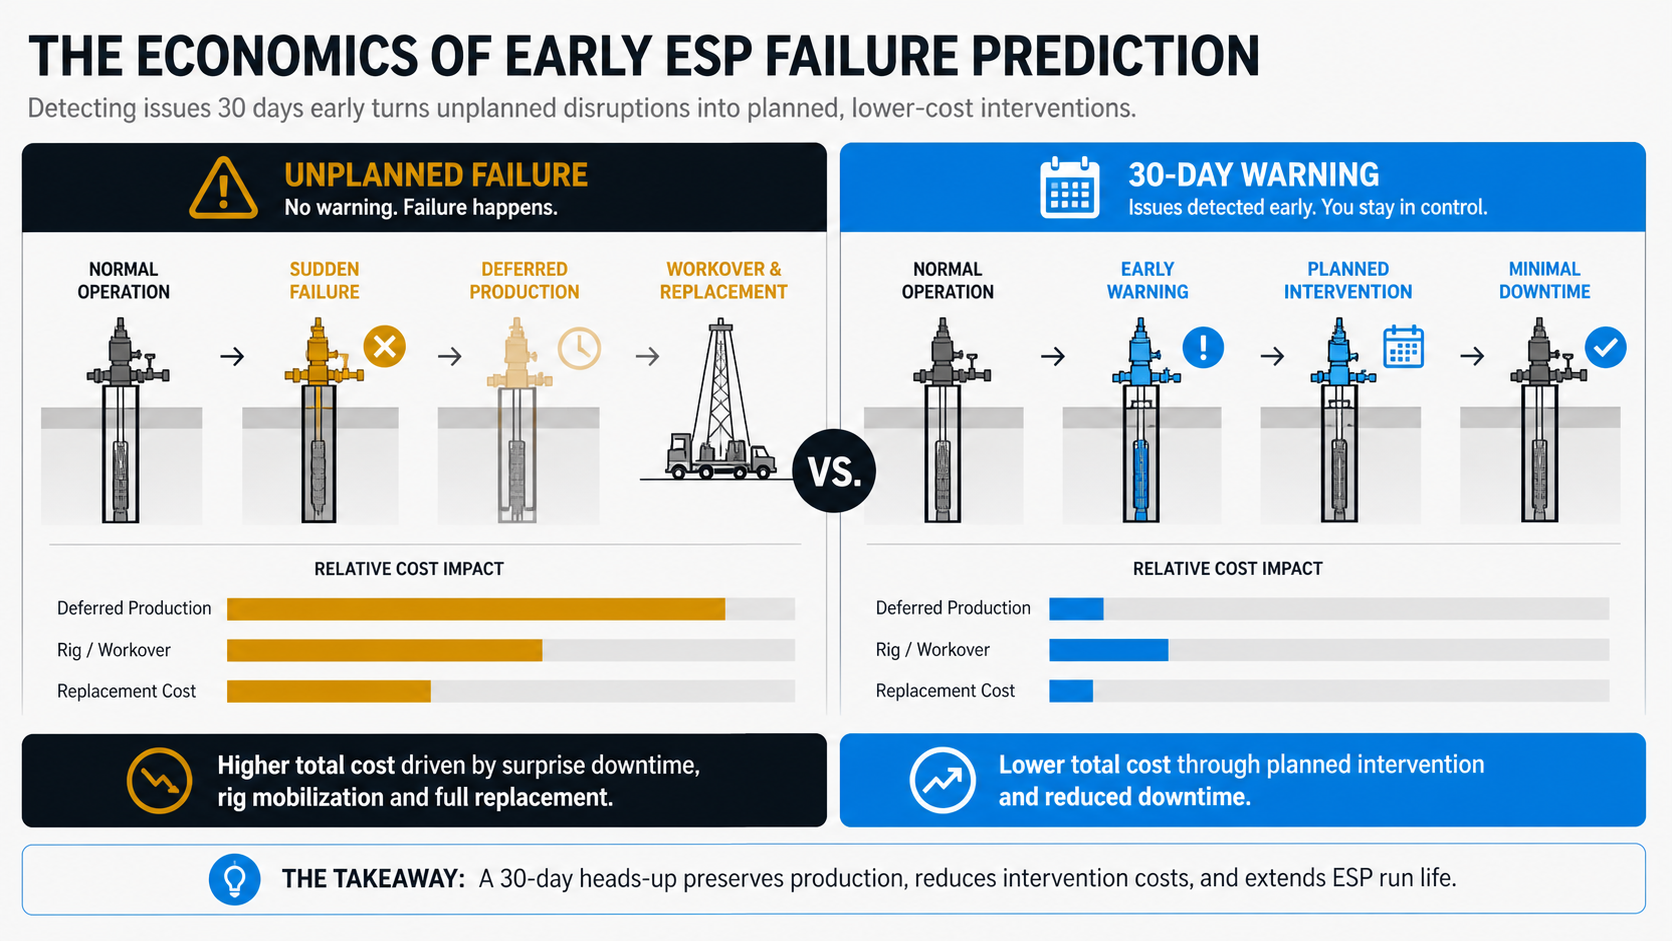
Industry-reported outcomes from predictive ESP maintenance programs cluster around a consistent story: run life extending from an average 18 months to 36 months or more, a 60% reduction in unplanned pulls compared to run-to-failure or fixed-calendar maintenance, and typical warning lead times of 7 to 30 days depending on failure mode. Put together, operators running these programs report roughly $2.5M in annual savings per 100 wells, with a 5:1 to 10:1 first-year return once you count the avoided workovers and the deferred production that never happened.
That ROI is the reason this has moved from a research curiosity to something operations teams are actually budgeting for — the payback period on the modeling work itself is typically a single avoided failure.
What a 30-Day Warning Actually Looks Like
The abstract idea of “predictive maintenance” is easy to nod along to; what it looks like day-to-day is more concrete. Here’s a representative timeline from health-score nominal to a planned intervention:
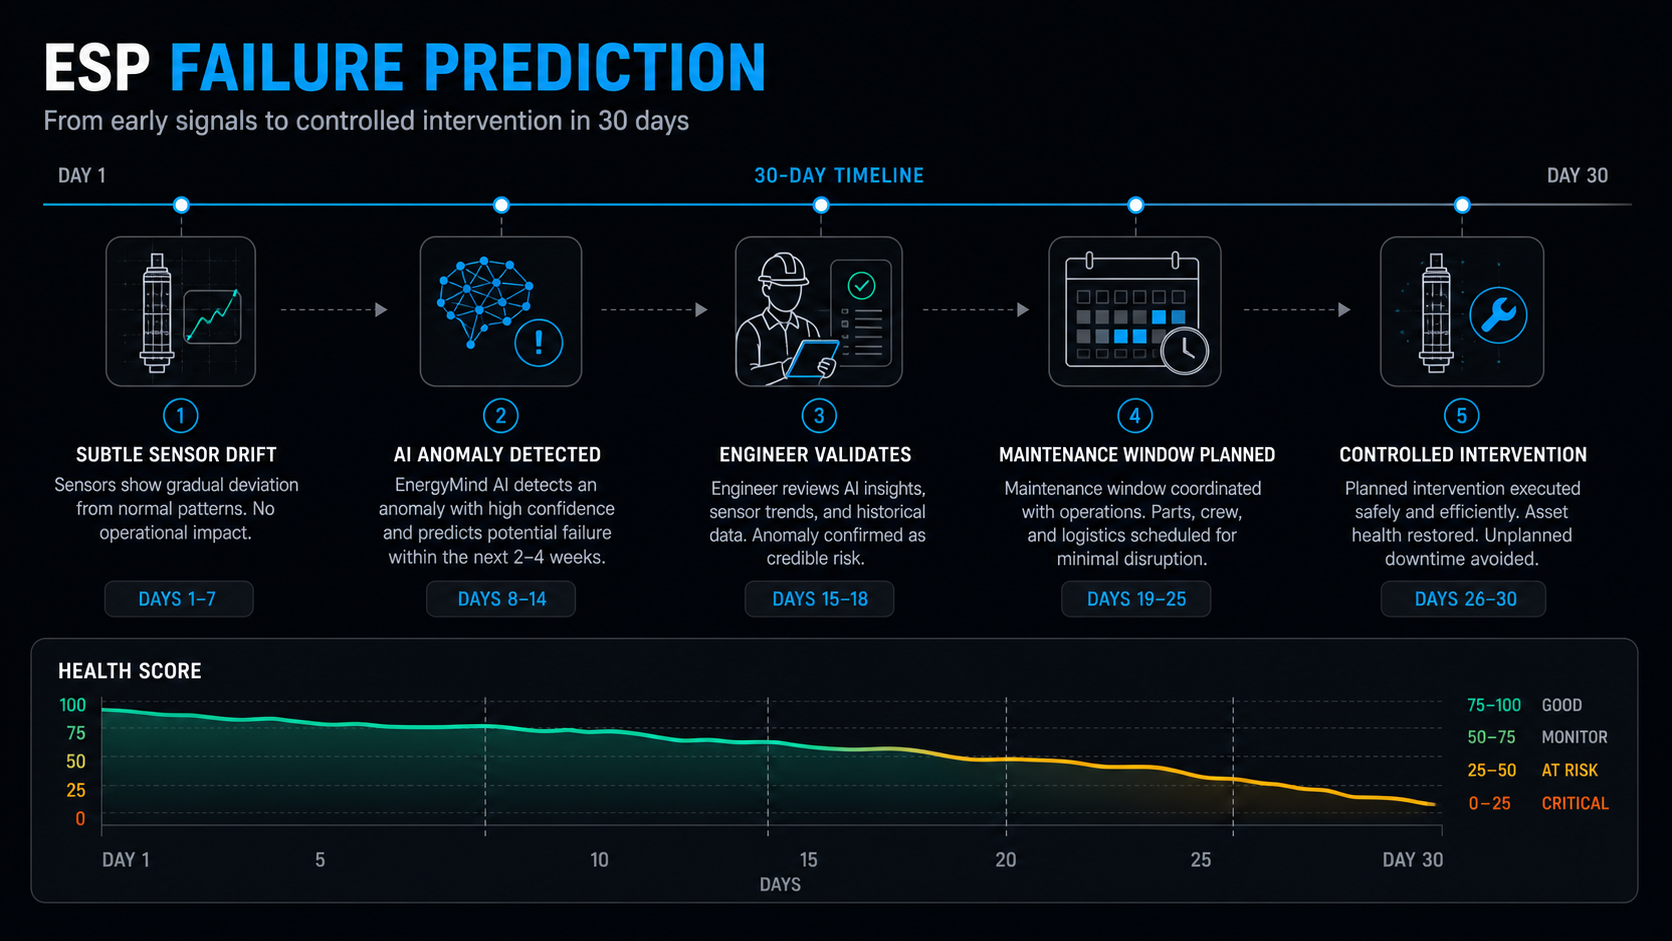
Day 0 is a normal baseline current and temperature signature. By day 9, motor temperature has started trending up and vibration RMS is drifting, but nothing has crossed an alarm threshold a human would notice on a dashboard. Around day 19, the model’s failure probability crosses its alert threshold and flags the well. By day 26, a work order goes out and the pull gets scheduled around existing rig availability — not an emergency mobilization. By day 30, the pump comes out on a planned trip instead of an emergency one, with the right rental equipment already staged.
That gap between day 9 (early drift, invisible to a human watching raw trends) and day 19 (model alert) is the entire value proposition. It’s not that the model sees something impossible to see — it’s that it’s watching the relative drift across eight correlated channels continuously, which a person checking a SCADA screen once a shift structurally can’t do.
Building This With Tools You Probably Already Have
You don’t need a bespoke ML platform to prototype this. A reasonable starting stack is Python and pandas to pull and clean historical VSD tag data, a decision-tree or gradient-boosted classifier from a standard ML library to start with the eight-parameter feature set above, and a labeled set of past failures (pulled from workover records) to train against. The petropt library is also worth a look if you’re already doing PVT or multiphase-flow work in Python and want artificial-lift utilities in the same environment.
The heavier lift isn’t the modeling — it’s assembling a clean, labeled failure history. Most operators already have the workover records; the work is joining them back to the sensor data with the right time offsets so the model learns “this pattern of drift, 20 days before this failure type” rather than noise.
Do You Build This or Buy It?
A fair question once you’ve seen the pieces laid out: does a field team build this in-house, or license one of the commercial ESP surveillance platforms that VSD manufacturers and service companies already sell? The honest answer depends on well count and data maturity. A field running a handful of ESP wells with clean historical SCADA data can prototype the eight-parameter classifier described above in a few weeks with an engineer who knows Python and the existing workover records — the model itself isn’t the hard part, and there’s real value in understanding exactly what it’s alerting on.
At field scale — hundreds of ESP wells across multiple pads — the calculus shifts toward a vendor platform, because the harder problem stops being the model and becomes the infrastructure: real-time tag ingestion from every VSD, alert routing to the right pumper or engineer, a dashboard the whole team actually opens, and someone maintaining all of that as sensors drift and wells get worked over. That’s a data-engineering and change-management problem as much as a modeling one, and it’s exactly what commercial artificial-lift optimization platforms are built to solve. Either path starts from the same place, though: a clean, time-aligned history of sensor readings and workover outcomes. Build that first, and the build-versus-buy decision gets a lot easier to make well.
Common Pitfalls
- Training on too few labeled failures. Eight failure types need enough historical examples of each to train against — a field with only a handful of documented cable faults won’t produce a reliable cable-fault classifier no matter how much healthy-operation data you feed it.
- Treating the health score as binary. A single alert threshold ignores that different failure modes have very different lead times — a 48-hour gas lock warning needs a different response process than a 30-day cable fault warning.
- Skipping the sanity check. Verify a new alert against the raw current and temperature trend before dispatching a crew. False positives erode trust in the system faster than almost anything else.
This approach sits alongside the broader shift toward AI-driven predictive maintenance tools across upstream equipment, and it pairs well with the same discipline used in automating pipeline integrity reporting — catching a slow-building problem from routine data instead of waiting for a failure event. If you’re building out the production-side data pipeline this depends on, our tutorial on automating decline curve analysis covers the same “let the model watch the trend” pattern applied to reservoir performance instead of equipment health.
The Bottom Line
ESP failures aren’t random — they’re mechanical and electrical processes that leave a trail in the same current, temperature, and pressure data your VSD is already logging. The difference between a $500,000 emergency pull and a $150,000 planned one is usually just whether anyone was watching the right eight numbers closely enough, early enough. That’s a problem machine learning is well suited to, and one that pays for itself the first time it catches a failure your team would otherwise have found out about at 2 a.m.
