

By Saad Iqbal
A gas well starts loading up with liquid, production drops off a cliff, and someone on the team suggests plunger lift. Fair enough — it’s cheap, it’s mechanically simple, and it needs no power source beyond the well’s own gas. The part that actually determines whether it works is the part most operators skip: does this well even make enough gas to lift the slug it’s accumulating, and if so, how long should the controller leave it shut in between cycles? Foss and Gaul answered both questions in 1965, and the method still holds up as the hand-calculation backbone behind every plunger controller’s auto-adjust logic sold today.
Why Plunger Timing Still Gets Set by Guesswork
Walk up to most plunger-lifted wells on a mature pad and the cycle times on the controller were set once, by whoever commissioned the well, and rarely revisited unless something breaks. That’s not laziness — it’s because the actual sizing calculation has several interlocking steps, and doing it by hand for every well in a hundred-well portfolio isn’t realistic without a script. This tutorial works through Foss and Gaul’s method end to end on one well, then turns it into a Python function you can run against every well on the pad in seconds.
Prerequisites
- Well depth to the plunger’s bottom stop, in feet (true vertical or measured, whichever the well is close to vertical enough to treat as equal)
- Average liquid production rate, bbl/day
- Available produced gas rate, scf/day
- Tubing inside diameter, inches
- A reasonable estimate of expected slug length, ft (150–200 ft is a common starting assumption for a packerless completion)
- Python 3 installed, if you want to run the automation step
Step 1 — Confirm the Well Clears the Minimum GLR Rule
Before sizing anything, check whether the well even makes enough gas per barrel of liquid to run a plunger at all. The long-standing rule of thumb for a packerless plunger installation is a minimum gas-liquid ratio of roughly 400 scf/bbl for every 1,000 ft of lift:
Minimum GLR (scf/bbl) = 400 × (D / 1,000)

D = well depth to plunger bottom stop, ft
Worked example: a well at D = 6,500 ft, producing qL = 15 bbl/day of liquid and qg = 45,000 scf/day of gas. The well’s actual GLR is 45,000 / 15 = 3,000 scf/bbl. The minimum required is 400 × (6,500/1,000) = 2,600 scf/bbl. At 3,000 scf/bbl, this well sits 15.4% above the minimum — a workable margin, not a knife-edge call. A well that came in below the minimum line would need a different lift method, or a packer-assisted plunger design with a lower gas requirement, before this whole exercise is worth doing.

Step 2 — Size the Tubing Capacity and Slug Volume
Everything downstream of this step depends on how much liquid one slug actually carries, which depends on tubing capacity. The standard oilfield cylinder-capacity formula, with ID in inches and capacity in barrels per foot:
Capacity (bbl/ft) = ID² / 1029.4

Worked example: 2-3/8 in EUE tubing, ID = 1.995 in
Capacity = 1.995² / 1029.4 = 3.980 / 1029.4 = 0.00387 bbl/ft
Assume a 150 ft slug length — a reasonable planning value until the well’s actual behavior tells you otherwise:
Slug volume (bbl) = Slug length (ft) × Capacity (bbl/ft)
                   = 150 × 0.00387
                   = 0.580 bbl per cycle
That 0.580 bbl is the single number every other calculation in this tutorial builds on — it’s how many cycles per day you need, and it’s the basis for the gas required to lift each one.

Step 3 — Check Gas-Limited Capacity and Set the Cycle Timing Budget
First, how many cycles per day does this well actually need to clear its liquid? Divide daily liquid rate by slug volume:
Cycles needed/day = qL / Slug volume = 15 / 0.580 = 25.9 cycles/day
Now check whether the well’s available gas can actually support that many cycles. Foss and Gaul’s charts express the gas required to lift one slug as a constant (tubing-size and pressure dependent) multiplied by depth in thousands of feet. For 2-3/8 in tubing at this well’s operating pressure, that constant works out to roughly 0.232 Mcf per 1,000 ft:
Gas required per cycle (scf) = K × (D / 1,000) × 1,000
                              = 0.232 × 6.5 × 1,000
                              = 1,508 scf/cycle

Max cycles/day (gas-limited) = qg / Gas per cycle = 45,000 / 1,508 = 29.8 cycles/day
29.8 gas-limited cycles/day comfortably clears the 25.9 cycles/day the liquid rate actually needs — this well has gas to spare, not a bottleneck. If the gas-limited number had come out below the liquid-needed number, the fix is a longer afterflow period per cycle (fewer, bigger slugs) rather than forcing a cycle count the gas supply can’t support.
With cycle count settled, build the time budget for a single cycle. Plunger rise velocity runs around 1,000 ft/min once gas is driving it to surface; fall velocity is roughly 2,000 ft/min through the gas column but only about 172 ft/min through the liquid slug itself, since it has to push through the fluid rather than drop freely:
Rise time (min) = D / 1,000 = 6,500 / 1,000 = 6.5 min

Fall time (min) = (D − slug length) / 2,000 + slug length / 172
                = (6,500 − 150) / 2,000 + 150 / 172
                = 3.18 + 0.87
                = 4.0 min
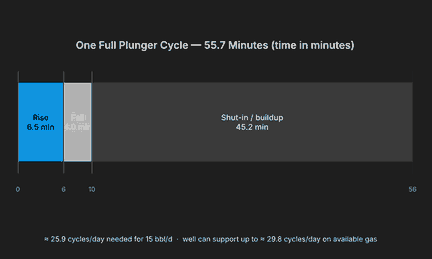
Total cycle time has to match the 25.9 cycles/day the liquid rate requires: 1,440 minutes / 25.9 cycles ≈ 55.7 minutes per cycle. Subtract rise and fall, and the shut-in (afterflow) period falls out as the remainder:
Shut-in time (min) = Total cycle time − Rise − Fall
                    = 55.7 − 6.5 − 4.0
                    = 45.2 min
That’s the full cycle: roughly 45.2 minutes shut in building the next slug, 6.5 minutes for the plunger to rise and deliver it to surface, and 4.0 minutes for the plunger to fall back to bottom before the next afterflow period starts — a 55.7-minute cycle, repeating about 26 times a day.
Step 4 — Automate the Full Design in Python
Every step above is arithmetic, which means it’s a good candidate for a reusable function. Python turns the full Foss and Gaul check — GLR screen, slug sizing, gas-limit check, and cycle timing — into one call you can run against every well on a pad:
def plunger_lift_design(depth_ft, ql_bpd, qg_scfd, tubing_id_in,
                         slug_len_ft=150, gas_const_mcf_per_1000ft=0.232,
                         rise_fpm=1000, fall_gas_fpm=2000, fall_liquid_fpm=172):
    """Foss & Gaul plunger lift design check for one well."""
    # Step 1: minimum GLR screen
    min_glr = 400 * (depth_ft / 1000)
    actual_glr = qg_scfd / ql_bpd
    glr_margin_pct = (actual_glr - min_glr) / min_glr * 100

    # Step 2: tubing capacity and slug volume
    capacity_bblft = tubing_id_in ** 2 / 1029.4
    slug_bbl = slug_len_ft * capacity_bblft

    # Step 3a: cycles needed vs. gas-limited max
    cycles_needed = ql_bpd / slug_bbl
    gas_per_cycle_scf = gas_const_mcf_per_1000ft * (depth_ft / 1000) * 1000
    max_cycles_gas = qg_scfd / gas_per_cycle_scf

    # Step 3b: cycle timing
    rise_min = depth_ft / rise_fpm
    fall_min = (depth_ft - slug_len_ft) / fall_gas_fpm + slug_len_ft / fall_liquid_fpm
    total_cycle_min = 1440 / cycles_needed
    shutin_min = total_cycle_min - rise_min - fall_min

    return {
        "actual_glr": round(actual_glr, 0),
        "min_glr": round(min_glr, 0),
        "glr_margin_pct": round(glr_margin_pct, 1),
        "slug_bbl": round(slug_bbl, 3),
        "cycles_needed_per_day": round(cycles_needed, 1),
        "max_cycles_gas_limited": round(max_cycles_gas, 1),
        "gas_feasible": max_cycles_gas >= cycles_needed,
        "rise_min": round(rise_min, 1),
        "fall_min": round(fall_min, 1),
        "shutin_min": round(shutin_min, 1),
        "total_cycle_min": round(total_cycle_min, 1),
    }

result = plunger_lift_design(
    depth_ft=6500, ql_bpd=15, qg_scfd=45000, tubing_id_in=1.995
)
for k, v in result.items():
    print(f"{k:24s}: {v}")

# actual_glr              : 3000.0
# min_glr                 : 2600.0
# glr_margin_pct          : 15.4
# slug_bbl                : 0.58
# cycles_needed_per_day   : 25.9
# max_cycles_gas_limited  : 29.8
# gas_feasible            : True
# rise_min                : 6.5
# fall_min                : 4.0
# shutin_min              : 45.2
# total_cycle_min         : 55.7
Every number matches the hand calculation above, and now it’s a function call instead of six separate worksheet formulas — run it against a pandas DataFrame of wells and you get a feasibility and cycle-time table for an entire pad in one pass.

Expected Result and How to Verify It
For this well, you should land on a 15.4% GLR margin, a 0.580 bbl slug, 25.9 cycles/day needed against 29.8 gas-limited cycles/day available, and a 55.7-minute cycle split into 6.5 minutes rise, 4.0 minutes fall, and 45.2 minutes shut-in. Verify it two ways: first, confirm cycles_needed_per_day is always less than max_cycles_gas_limited — if it isn’t, the design as specified can’t actually run at the liquid rate you assumed, and the fix is a longer slug (fewer, bigger cycles) or a smaller tubing size, not forcing the timer faster. Second, sanity-check that rise_min + fall_min + shutin_min reproduces total_cycle_min to within rounding; a mismatch there almost always means a sign error in the fall-time split between the gas and liquid portions of the well.
Common Pitfalls
- Skipping the minimum GLR screen. A well below the minimum ratio will never cycle reliably no matter how the timer is tuned — catch this before investing in equipment, not after a string of failed-to-surface events.
- Assuming a fixed slug length forever. 150 ft is a reasonable starting assumption, but actual slug size drifts with reservoir pressure and water cut over the well’s life — re-run the design whenever production trends shift materially, not just at initial installation.
- Treating the gas-limited cycle count as a target instead of a ceiling. Running right up against max_cycles_gas_limited leaves no margin for a bad day of produced-gas rate; design with headroom, the same way this well’s 25.9-vs-29.8 margin leaves room before gas becomes the binding constraint.
Once the cycle is sized, the natural next step is deciding whether this well would benefit from a controller that adjusts these set points automatically as conditions drift — our roundup of AI plunger lift optimization tools compares what’s actually on the market for that. If liquid loading is a field-wide pattern rather than a single-well problem, it’s also worth cross-checking candidate wells against a nodal analysis model, and if gas lift is a live alternative on the same pad, our gas lift valve spacing guide covers that design path.
Got a well with real depth, rate and tubing numbers? Run them through the script above before your next controller setting change and see how much margin you’re actually carrying.
