

Nine stages pumped, nine stages logged, and the production log tells the completions engineer something she didn’t want to see: three of the thirty-six perforation clusters on this lateral are doing almost nothing. Same pump schedule, same proppant concentration, same diverter pill timing as the last well on the pad — and still, roughly half the clusters she paid to perforate and stimulate are barely taking fluid. The well will still come online and make decent oil. It just won’t make what the type curve said it should, and nobody can say exactly why until someone goes back through the raw fiber data stage by stage.
This is the quiet tax on plug-and-perf completions: you pump into every cluster you designed, but the rock only lets some of them actually flow. Perforation cluster efficiency — the share of clusters that genuinely contribute to production rather than just sitting there looking stimulated on paper — is one of the most expensive blind spots in unconventional development, and it’s exactly the kind of problem distributed acoustic sensing (DAS) and machine learning were built to expose.
By Saad Iqbal. I write about the places where AI and better field data change a completions engineer’s actual decisions, not just their dashboards. This one is about reading fiber-optic DAS data with machine learning to find out which perforation clusters are really flowing, which ones were never going to, and what that tells you about the next well’s design.
Why Perforation Cluster Efficiency Is a Problem Nobody Sees on the AFE
A plug-and-perf completion is designed on the assumption that every cluster takes roughly its fair share of fluid and proppant. In practice, that assumption breaks down constantly. Stress shadowing between clusters, heel-to-toe pressure drop along the lateral, natural fracture networks that steal flow, and simple perforation erosion all push fluid toward the path of least resistance — which is rarely evenly distributed across every cluster you shot.
Production logging studies reviewed in SPE’s Journal of Petroleum Technology put a number on just how common this is: on average, only 50% to 60% of perforation clusters in horizontal, multi-cluster unconventional wells contribute significantly to production. That means, on a typical 30-plus cluster lateral, something like a third to a half of the stimulated rock volume you paid for in pump time, proppant, and water never really pays you back. It’s not a rounding error. It’s the difference between a well that hits its type curve and one that quietly underperforms for the next fifteen years, with nobody quite sure why.
The frustrating part is that this used to be almost unknowable in real time. A production log run months after first flow can tell you which intervals are contributing today, but it can’t tell you what happened stage by stage during the frac itself, when the design could actually still be adjusted. That’s the gap distributed acoustic sensing fills.
What Distributed Acoustic Sensing Actually Records
A DAS system sends laser pulses down a fiber-optic cable — run inside the casing, strapped to it, or installed in a dedicated monitoring well — and measures how backscattered light shifts as the fiber stretches and relaxes. That strain, sampled at every point along the cable many times a second, turns the entire wellbore into a continuous acoustic and strain-rate sensor with depth resolution down to a meter or so.
During a frac stage, each perforation cluster that’s actually taking fluid generates its own acoustic and low-frequency strain signature as fluid and proppant blast through it. Plot depth on one axis and time on the other, and you get the classic DAS “waterfall” display: bright, energetic bands where clusters are loud and clearly flowing, and faint or silent bands where a cluster is barely participating, or has already screened out, eroded past usefulness, or lost the fluid race to a louder neighbor three feet away.
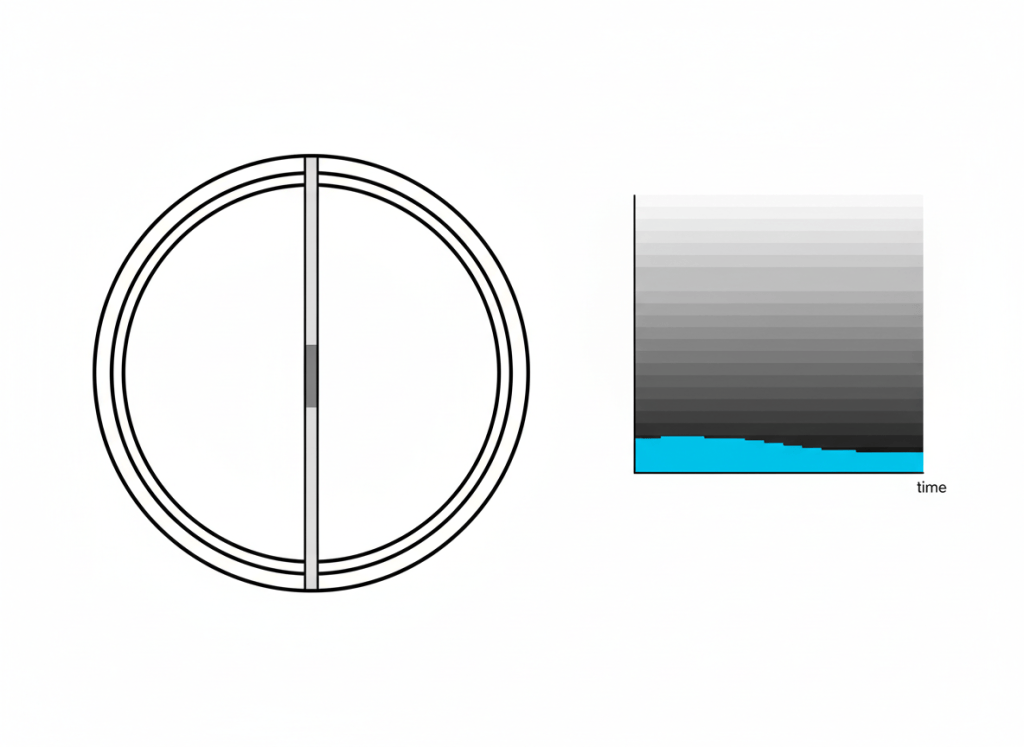
Raw, that waterfall is just noise to the naked eye — tens of thousands of data points per stage, across potentially fifty stages on a long lateral. Reading it by hand, cluster by cluster, stage by stage, is exactly the kind of repetitive pattern-recognition task that doesn’t scale to a real completions program. That’s where machine learning earns its place in the workflow, not as a buzzword but as the only practical way to turn a waterfall plot into an answer an engineer can act on before the frac crew moves to the next pad.
From Noisy Waterfalls to a Cluster Efficiency Scorecard
The AI layer in modern fiber-optic completions diagnostics does three things that matter to the engineer, not the data scientist:
- Isolates each cluster’s acoustic signature. Signal-processing and classification models separate true frac-related strain energy from pump noise, wellbore ringing, and the signal from neighboring clusters, then integrate it over the pumping window to get one energy value per cluster per stage.
- Scores relative contribution. Each cluster’s energy is normalized against its stage average (or against a reference “well-behaved” stage), producing a 0-to-1 efficiency score instead of a raw, hard-to-compare acoustic number.
- Flags anomalies as they happen. A cluster’s signature broadening or changing character mid-stage is a classic signature of perforation erosion opening up a dominant flow path — useful to know while there’s still time to adjust diverter timing on the next stage, not three weeks later in a report.

You don’t need proprietary software to understand the core logic. A simplified version of the scoring step, run on pre-processed per-cluster energy values, looks like this in Python with pandas:
import pandas as pd

# df: one row per (well_id, stage, cluster) with integrated
# strain energy for that cluster during the pumping window
df["energy_score"] = df.groupby(["well_id", "stage"])["strain_energy"].transform(
    lambda x: x / x.mean()
)

# Flag clusters taking less than half their stage's average energy
df["underperforming"] = df["energy_score"] < 0.5

summary = (
    df.groupby("well_id")["underperforming"]
    .mean()
    .rename("pct_clusters_underperforming")
    .reset_index()
)

print(summary)
That's a deliberately simplified version of what commercial fiber-optic analytics platforms from vendors like SLB (through its Silixa Carina fiber-sensing line) and completions-focused partnerships between Baker Hughes, Weatherford, and fiber-optic analytics specialists like LYTT do at much greater sophistication — with proper noise filtering, depth calibration, and validation against production logs. The principle, though, is the same one you can prototype yourself: normalize each cluster against its peers, and let the outliers tell you where the design broke down.
What Engineers Actually Do With the Score
A cluster efficiency score is only useful if it changes a decision. In practice, teams running this workflow use it in three places:
- Mid-job diverter timing. If early clusters in a stage are clearly dominating, a diverter pill can be moved up to force fluid toward the underperforming clusters before the stage is finished pumping, instead of after the fact.
- Next-well perforation and limited-entry design. A pad consistently showing 60%+ cluster underperformance in the toe-ward half of its laterals is telling you something about perforation diameter, cluster spacing, or hole count that a tighter limited-entry design or shorter cluster spacing on the next well can address directly.
- Completions vendor and diverter selection. Comparing cluster efficiency scores across offset wells that used different diverter chemistries or perforation guns turns a marketing claim into a measured, well-by-well comparison, similar in spirit to how our piece on the best AI hydraulic fracturing design tools compares frac simulators on predicted versus actual outcomes.

A frac hit on an offset well complicates this picture further, since fluid lost to a neighboring wellbore can look, acoustically, a lot like a highly "efficient" cluster that's really just leaking pressure communication somewhere it shouldn't. If you're seeing cluster scores that look too good to be true on a pad with tight spacing, it's worth cross-checking against the kind of real-time anomaly detection covered in our explainer on AI frac hit detection on multi-well pads before you credit the diverter design for something a frac hit actually caused.
Where This Still Needs a Human
Two honest limits are worth stating plainly. First, DAS-based cluster scoring is a proxy for flow, not a direct rate measurement; the acoustic energy correlates well with fluid and proppant velocity through a perforation, but calibrating that correlation against an actual production log, at least on a handful of wells per play, is what keeps the model honest rather than internally consistent but quietly wrong. Second, fiber installation isn't free — permanent monitoring wells and retrievable wireline fiber both add cost and rig time, so the economics only work when the insight changes enough future completions designs to pay for the fiber on the wells that have it, and the ones that don't.
Practical Takeaways
- Expect roughly 40% to 50% of your perforation clusters to be underperforming on an average plug-and-perf lateral — that's the published baseline, not a sign something is specifically broken on your pad.
- DAS turns the wellbore into a continuous strain sensor; the waterfall plot it produces is unreadable by hand at scale, which is exactly the problem a classification and scoring model solves.
- Normalize each cluster's acoustic energy against its own stage average before comparing across stages or wells — raw energy values aren't comparable on their own.
- Use the cluster score to adjust diverter timing mid-job and perforation design on the next well, not just to generate a prettier end-of-well report.
- Cross-check unusually high "efficiency" scores on tightly spaced pads against frac-hit signatures before crediting the completion design for something well interference actually caused.
The clusters that don't flow aren't a mystery anymore, they're a measurement problem, and fiber optics plus a reasonably simple scoring model solves most of it. The engineers getting ahead on this aren't buying a fundamentally different frac design. They're finally able to see which half of their existing design was working all along.
