
By Saad Iqbal
A pumper checking a lease of forty rod-pumped wells pulls up the surface card on well twelve and something’s off — the loop is narrower than yesterday, dips a little on the downstroke. Is that gas interference working its way in, a pump starting to go off, or just a noisy sensor reading? On a good day he catches it and calls it in. On a busy day, that well pumps for another two weeks with a worn traveling valve quietly hammering the rods, and the failure shows up as a parted string instead of a scheduled workover. Multiply that judgment call by every well on the lease, every shift, and it’s obvious why AI dynamometer card diagnostics has become one of the more useful, unglamorous applications of machine learning in artificial lift.
What a Missed Card Read Actually Costs
Sucker rod pumps are still the most common artificial lift method on producing wells worldwide, precisely because they’re mechanically simple and cheap to run — right up until something downhole starts to fail quietly. A pump running with undetected gas interference is producing below its potential every single day it goes uncorrected, which is lost revenue that never shows up as an alarm, just as a slightly disappointing decline curve nobody investigates. Fluid pound is worse: it’s not just inefficient, it’s actively hammering the rod string and pump barrel on every stroke, turning a minor efficiency problem into a parted rod or a stuck pump weeks later. A workover rig to pull and repair a failed rod pump is a real cost and real downtime, and the frustrating part is that the card usually showed the problem developing for days or weeks before the failure — the data existed, it just wasn’t being watched closely enough to act on.
Why Reading a Card by Eye Doesn’t Scale
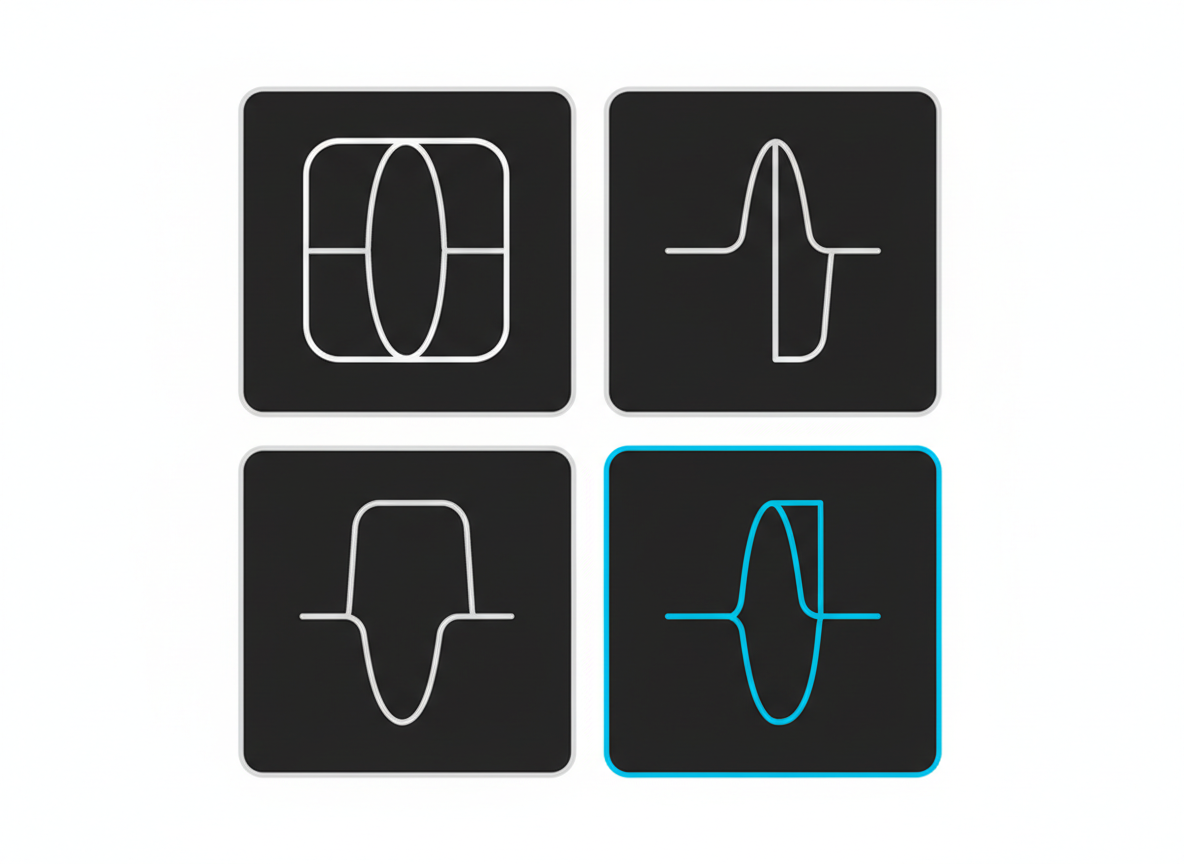
A dynamometer card is a load-versus-position plot recorded at surface as the polished rod moves through one full pumping stroke. A trained eye can read a lot into that closed loop — a normal card is roughly rectangular; pump-off (the pump outrunning the fluid coming into it) shows up as a distinctive drop on the downstroke; gas interference softens and rounds the corners; a worn or leaking traveling valve or standing valve changes exactly where the load transfers on the up- and down-strokes. The physics is well understood and has been for decades. The bottleneck was never the diagnostic knowledge — it was the number of wells one engineer can watch closely enough, often enough, to catch a card changing shape before it becomes a failure.
How the Physics Becomes a Signal AI Can Read
The surface card alone doesn’t tell the whole story, because the rod string stretches and the load you measure at surface isn’t the load happening downhole at the pump. Classic well-testing methods use the wave equation to convert the surface card into an estimated downhole card, and that downhole shape is what actually reflects the pump’s condition. What’s changed is what happens next: instead of an engineer eyeballing the converted card, the load-position curve becomes an input array to a classifier. Published research has used transfer learning with convolutional networks like GoogLeNet, and separately support vector machines paired with transfer learning, to automatically sort dynamometer cards into working-condition categories at a scale no engineer could match manually across a full field.
Transfer learning matters here for a practical reason: labeled failure data is scarce on any single lease. A model pretrained on a large general image dataset and then fine-tuned on a comparatively small set of labeled dynamometer cards learns useful shape features faster than one trained from scratch, which is exactly the constraint most operators face — plenty of card data, far fewer confirmed, labeled failure events to train against. That’s also why sensor-fault detection has become its own research thread alongside pump-condition classification: a model needs to first tell the difference between a genuinely faulted pump and a card that’s just been corrupted by a bad load cell or a comms dropout, or it will chase phantom failures.

What Can AI Actually Detect From a Dynamometer Card?
The condition categories these models are trained to separate map directly onto the failure modes field engineers already know by name:
- Pump-off — the pump is producing faster than the well can deliver fluid, seen as a sharp load drop partway through the downstroke.
- Gas interference — free gas in the pump chamber rounds and compresses the card, reducing effective displacement.
- Fluid pound — a more severe version of gas interference or pump-off where the plunger impacts fluid on the downstroke, showing up as a sharp spike that also does real mechanical damage over time.
- Traveling or standing valve leaks — the load transfer point shifts away from where it should occur at the top or bottom of the stroke.
- Worn plunger or barrel — a gradual loss of the card’s peak-to-peak load range over many cycles, easy to miss card-by-card and much easier to catch as a trend.
A Basic Card-Shape Feature in Python
Before reaching for a trained classifier, a surprisingly useful first feature is just the enclosed area of the card — the pump’s effective work per stroke — tracked over time with pandas and Python. A shrinking trend flags wear; a sudden shape change flags something acute:
import numpy as np
import pandas as pd

def card_area(position_in, load_lbf):
    """Shoelace formula: enclosed area of one dynamometer card loop."""
    x = np.asarray(position_in)
    y = np.asarray(load_lbf)
    return 0.5 * abs(np.dot(x, np.roll(y, 1)) - np.dot(y, np.roll(x, 1)))

# cards: dict of {timestamp: (position_array, load_array)} for one well
areas = pd.Series(
    {ts: card_area(pos, load) for ts, (pos, load) in cards.items()}
).sort_index()

# 7-day rolling trend in effective pump work per stroke
trend = areas.rolling("7D").mean()
pct_change = trend.pct_change(periods=7)
That single number — card area over time — is a lightweight proxy for pump efficiency that a full classifier later refines into a specific diagnosis.
From Card to Action: Closing the Loop With Pump-Off Control
The real payoff isn’t just the diagnosis — it’s connecting the diagnosis to a controller that acts on it. Pump-off controllers have used simplified card logic for years to shut a well down before it pumps off and damages the rod string; the AI layer improves on that by classifying the full range of conditions above rather than just the one, and by learning well-specific patterns instead of relying on a single generic threshold. Vendors like Ambyint and ChampionX’s XSPOC platform build fleet-wide rod-lift optimization around exactly this kind of card analytics, closing the loop from diagnosis to stroke-speed or run-time adjustment without a human touching every well every day.

Getting Started on Your Own Lease
- Pull historical card data and any known failure or workover history for a set of wells — you need labeled examples of pump-off, gas interference, and valve failure before any classifier is useful.
- Start with the card-area trend above; it’s cheap, explainable, and already catches gradual wear.
- Convert surface cards to downhole cards with the wave equation before training a classifier — the surface shape alone is a distorted version of what’s actually happening at the pump.
- Validate every automated diagnosis against a field visit for the first few dozen flags — trust is earned well by well.
- Only connect diagnosis to automatic control action (stroke speed, shutdown) once the classification accuracy has been proven on your own wells, not just in a published paper.
Where This Still Needs an Engineer
A classifier trained on someone else’s field can mislabel a card shape it’s never seen — a well with an unusual deviation profile, a nonstandard pump, or a sensor calibration drift can all produce a card that looks like a fault when it isn’t. Card classification is also only as good as its downhole conversion; get the rod string properties wrong and every downstream diagnosis inherits that error. Treat AI dynamometer card diagnostics as a way to triage forty wells into the two or three that need a field visit today, not as a replacement for the production engineer’s final call.
This pairs naturally with AI ESP failure prediction from motor current signature analysis if your lease runs a mix of rod and electrical submersible pumps, and if you’re spacing out a gas lift install instead, the gas lift valve spacing calculation tutorial walks through automating that design in Python.
