
By Saad Iqbal
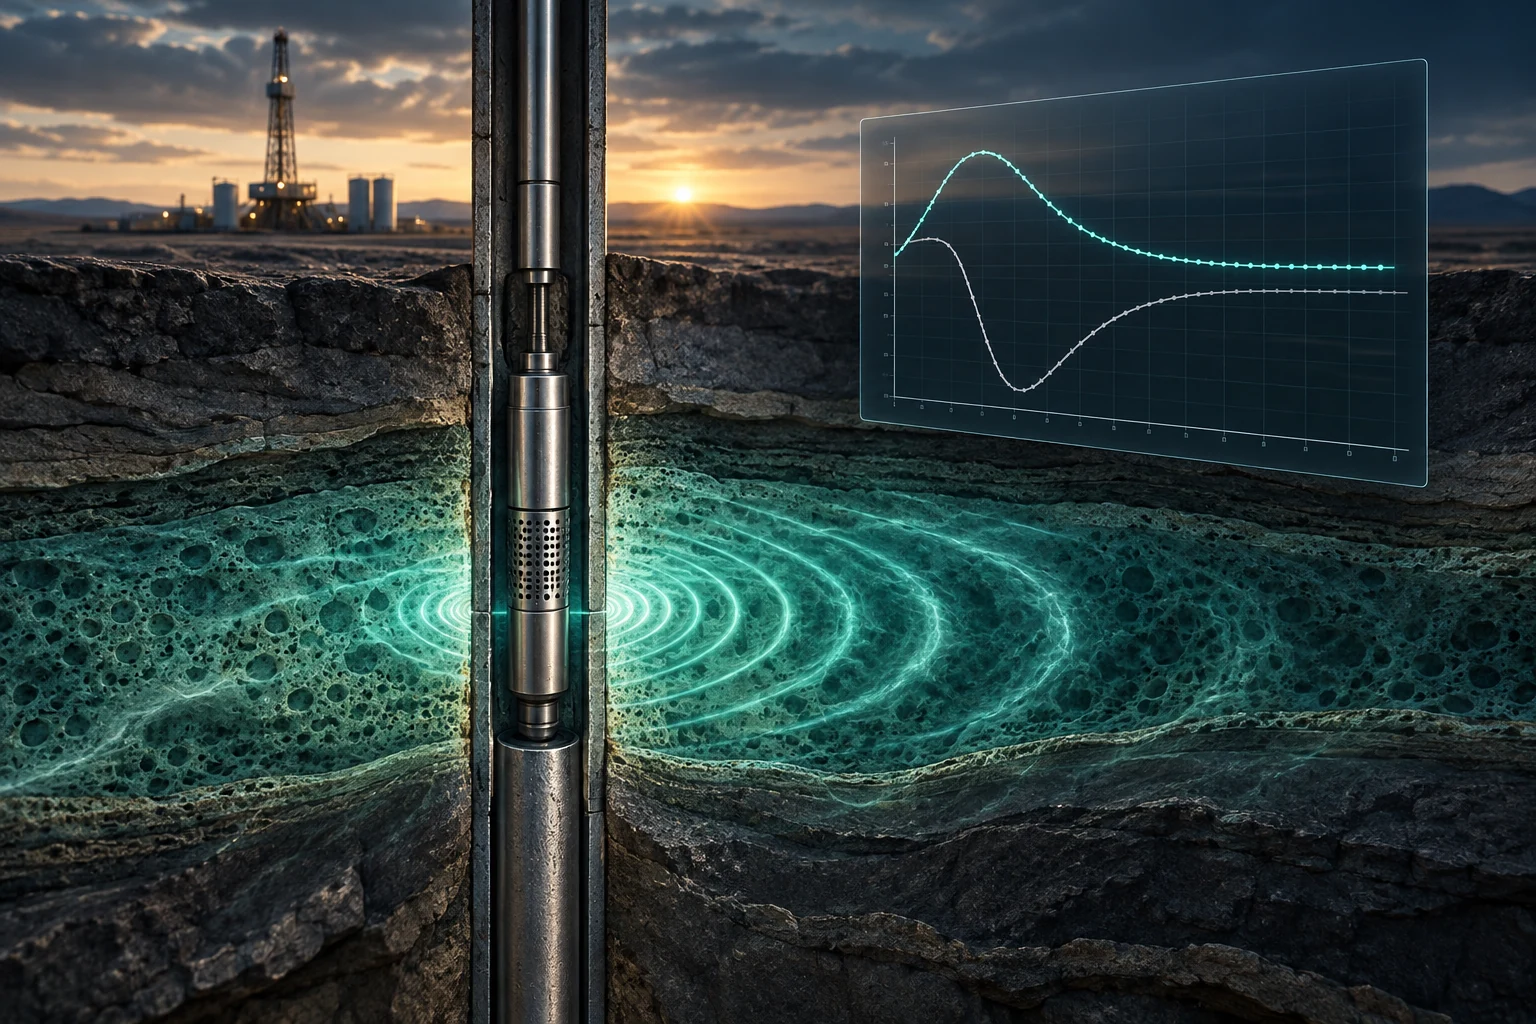
A pressure transient test still ends the same way it did twenty years ago: a gauge comes out of the well, a log log plot goes up on screen, and someone has to decide where wellbore storage ends and radial flow begins. What has changed is how much of that decision loop can now be automated, cross checked, or drafted by an AI copilot before an engineer ever touches the final interpretation.
This post compares the real, currently available tools upstream teams use for pressure transient analysis (PTA) in 2026, what each one actually does, where automation and AI genuinely help, and where a human still has to make the call.
Table of Contents
Why Pressure Transient Analysis Still Needs the Right Tool
A well test is expensive to run and expensive to get wrong. Shutting a well in for a buildup, or holding a flow rate steady for a drawdown, costs deferred production every hour the gauge is downhole. Once the data is in hand, a misread diagnostic plot doesn’t just produce a wrong number, it can drive a completion decision, a workover, or a development well spacing call that takes years to unwind.
A permeability estimate that’s off by half, or a skin value that hides a damaged near wellbore zone, propagates straight into the production forecast and the economics built on top of it. That’s the real reason the software matters: the value of PTA tooling isn’t the plot itself, it’s how reliably and how quickly it gets an engineer to a defensible interpretation they can act on.
Pressure transient analysis workflow
Every PTA workflow, regardless of vendor, moves through the same five stages: pull raw gauge pressure and rate data, compute the Bourdet derivative, match it against a diagnostic model, solve for permeability, skin and reservoir pressure, and write up the result. The tools below differ mainly in how much of steps two through five they automate, and how well they integrate with the rest of a reservoir engineer’s stack, including Horner plot buildup analysis, which remains the fallback method when derivative diagnostics are ambiguous or the test is too short for a clean radial flow line.

Pressure transient analysis diagnostic plots
Before comparing software, it helps to be clear on what all of it is trying to automate. The log log plot of pressure change (dp) and its Bourdet derivative (dp') against elapsed time is still the primary diagnostic tool in well test interpretation. Wellbore storage shows up as a unit slope line at early time, a transition hump often signals a near wellbore feature such as a fracture or partial penetration, and a flat derivative marks infinite acting radial flow, the region used to solve for permeability thickness and skin.

Every package below draws this same plot. What separates them is whether the flow regime identification, the model matching, and the sensitivity analysis around the final answer are manual, semi automated, or genuinely AI assisted.
Pressure transient analysis tools compared
1. KAPPA Workstation, Saphir
Saphir, the well test module of KAPPA’s Workstation suite, is a dedicated pressure transient analysis application. It automates derivative computation and model matching, ships an extensive library of analytical and numerical reservoir models, and supports diagnostic interpretation and model matching, with model choice and uncertainty remaining the engineer’s responsibility. It’s built for engineers who test wells regularly and need a defensible, auditable interpretation quickly, the automation shortens the loop, but the model choice and the QC of the match are still the engineer’s call.
2. SLB WellTest pressure transient analysis
SLB WellTest is dedicated pressure transient analysis software for drawdown, buildup, injection and falloff studies. Its published scope includes analytical and numerical interpretation and test design. Confirm the supported well geometry, fluid model and data exchange requirements for your particular test rather than assuming a general reservoir simulator supplies the same interpretation workflow.
3. KAPPA K A pressure surveillance
KAPPA K A targets high frequency permanent gauge data and automated surveillance using pressure transient analysis and rate transient analysis. It complements detailed interpretation workflows such as Saphir. This role is different from PROSPER well performance modelling. When continuous gauge data is available, evaluate how candidate events are extracted, reviewed and passed to an engineer for interpretation.
4. Python + AI Copilots (DIY)
The fourth option isn’t a single product but a workflow: open source Python (pandas, numpy, matplotlib) for the Bourdet derivative and diagnostic plot, plus a general purpose AI copilot, ChatGPT or Claude, to draft the derivative algorithm, the nonlinear regression for the model match, and the plotting code. We’ve walked through exactly this approach for buildup tests in our Horner plot in Python guide.
It costs nothing beyond engineering time, and it’s fully transparent and version controllable, every line of the derivative calculation is auditable, which isn’t always true of a commercial black box. The tradeoff is that there’s no vetted model library, no automated type curve matching, and no vendor support; it suits teams testing occasionally or wanting to understand the mechanics, not high volume well test operations.
Pressure transient analysis data quality
None of these tools can rescue a bad dataset, and it’s worth saying plainly because it’s the most common reason an interpretation goes wrong. A memory gauge with insufficient resolution will smear out the exact hump that separates wellbore storage from radial flow. Surface recorded pressure, converted downhole through a wellbore model, carries extra uncertainty that a derivative plot will happily amplify.
And a test that’s too short to reach a stabilized radial flow line will tempt an engineer, or an under constrained automated model selector, into fitting a plausible looking but wrong reservoir model. Automation and AI copilots speed up the mechanical steps; they don’t substitute for enough clean, well resolved gauge data, and every tool above still needs an engineer who can tell when the data itself, not the software, is the problem.
Pressure transient analysis for complex wells
Most of the discussion above assumes a simple vertical well in a homogeneous reservoir, but that’s rarely what’s actually on the gauge. Horizontal wells add early time linear flow and late time pseudo radial regimes that need a horizontal well model rather than the standard radial one. Layered or naturally fractured reservoirs can show a double porosity or double permeability signature, a second dip and rise in the derivative that’s easy to mistake for noise if you’re not looking for it. Multi rate tests, where the rate changes several times before shut in, need superposition time processing before the derivative means anything at all.
For non ideal wells, verify the specific models available in the selected pressure transient analysis application. Saphir and WellTest publish dedicated well test capabilities; a general reservoir simulator or nodal model should not be assumed to provide an equivalent model library. Python implementations need independent benchmark tests for superposition, derivatives and any analytical model used.
Choosing pressure transient analysis software
Compare Saphir and WellTest for dedicated pressure transient analysis. Evaluate KAPPA K A when permanent gauge surveillance and automated event extraction are the main requirements. Python can support data quality checks, plotting and validated educational examples. Choose by test complexity, audit requirements and support needs, rather than treating a general purpose AI assistant as a validated well test solver.
Pressure transient analysis practical takeaway
None of these tools remove the engineer from the loop, and none of them should. What automation and AI have changed is how fast you get from raw gauge data to a candidate interpretation, and how much of the mechanical work, derivative computation, regression, report drafting, can be delegated so the engineer’s time goes into judging the match, not producing it. Whichever route you pick, the log log diagnostic plot is still where the real decision gets made.
Pressure transient analysis acceptance checks
Preserve the rate history. Pressure transient analysis depends on the rate sequence that created the pressure response. Include prior production, changing rates, shut in timing and injection periods as appropriate. Align rate and gauge clocks. A wellhead shut in does not necessarily stop sandface flow immediately, so early time behavior can reflect storage rather than the reservoir.
Test derivative sensitivity. Compare reasonable smoothing intervals and inspect the original pressure trace. A derivative can amplify noise, and aggressive smoothing can hide real features. Do not choose a reservoir model from one processed curve alone. Record processing settings so another pressure transient analysis engineer can reproduce the diagnostic view.
Require evidence for the chosen regime. A nearly flat derivative over a short interval is a candidate radial flow region, not automatic proof. Check the pressure match, rate history and physical plausibility of the inferred parameters. If the test does not resolve the desired regime, report that limitation instead of forcing a precise permeability or boundary distance.
Separate matching from identification. Several pressure transient analysis models can fit noisy or short data. Compare alternatives and use completion details, geology and other observations to constrain them. A lower residual does not establish a unique reservoir description. Present the plausible model range and explain which observations favor the selected interpretation.
Reconcile parameter units. Distinguish permeability from permeability thickness, and confirm viscosity, formation volume factor, compressibility and completed interval thickness. Errors in these inputs can produce a plausible curve with an incorrect absolute parameter value. Keep the unit system and pressure datum visible in the interpretation report.
Use automation as an auditable step. Retain raw data, processing scripts, model settings and interpretation notes. AI drafted code should be tested against known solutions before field use. A pressure transient analysis report should identify what is measured, inferred and assumed, with uncertainty that reflects both data quality and model ambiguity.
