

By Saad Iqbal
It’s 2:14 a.m. on a deepwater rig, and the pit level has crept up by six barrels over the last twenty minutes. Nobody has moved a valve. The pump strokes are steady, the trip tank is shut in, and yet the mud tanks are filling themselves. The driller glances at the pit-gain alarm — still ten barrels from tripping — and keeps watching. That gap between “something is wrong” and “the alarm agrees with you” is where blowouts are born. It is also exactly the gap that AI anomaly detection has started to close.
What Actually Happens When a Well Kicks
A kick is simple in principle: formation pressure exceeds the hydrostatic pressure the mud column is exerting on the reservoir, and fluid — gas, oil, or water — flows into the wellbore instead of staying put. The classic surface indicators are a rising pit volume (pit gain), a return flow rate that outruns the pump rate (Qout > Qin), an unexplained drilling break, and a standpipe pressure that sags as lighter formation fluid displaces heavier mud in the annulus. None of these signs is new; they’ve been in well-control manuals for fifty years. What has changed is how fast, and how reliably, they can be read.
The standard surface method is pit-volume totalizing (PVT): ultrasonic or radar sensors track tank levels, and an alarm fires once the cumulative gain crosses a fixed threshold — typically 10 to 20 barrels. The companion method is delta-flow monitoring, comparing pumped flow-in (Qin) against measured flow-out (Qout) using paddle or Coriolis meters:
ΔQ = Qout − Qin
A sustained positive ΔQ that isn’t explained by a connection, a survey, or a slug of trapped gas is the textbook kick signature. The problem is that both methods were designed around fixed thresholds tuned for the average well, on the average day, in average sea state — and reality rarely cooperates.
Why the Old Alarm Is So Often Wrong
Rig heave sloshes the pits. Trip-tank transfers look like influx. Gas-cut mud from a connection creates a transient ΔQ spike that has nothing to do with a real kick. Reviews of field kick-detection performance have found conventional pit-gain and delta-flow alarms carrying false-alarm rates between 30% and 50%. When a third to a half of your alarms are noise, crews start tuning them out — and that desensitization is exactly what turns a manageable influx into a well-control event.

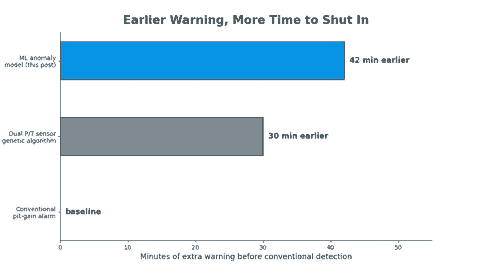
Better hardware helps close the gap. Wired drill pipe transmits at up to 57,000 bits per second — roughly 2,500 times faster than conventional mud-pulse telemetry — which matters most during connections, when pumps are off and traditional flow-based detection goes blind. Distributed acoustic sensing (DAS) on fiber-optic cable has demonstrated around 81% automated detection accuracy, though it loses sensitivity once gas concentration climbs past roughly 5%. Dual pressure-temperature sensor pairs, combined with a genetic-algorithm inversion, have been shown to flag an influx up to 30 minutes earlier than conventional methods, with less than 10% error estimating gas fraction. None of this hardware is cheap or universal — which is why the more interesting shift is happening in software, on data most rigs already collect.
How Machine Learning Reads the Signal Earlier
The core idea behind AI early kick detection is to stop asking “has the pit gain crossed 15 barrels?” and start asking “does this multivariate pattern look like the drilling process I’ve been watching for the last six hours?” That reframes kick detection as an anomaly-detection problem, and it’s why the published architectures cluster around a few well-understood model families:
- Artificial neural networks (ANNs) trained on labeled historical kicks to classify drilling-parameter windows as normal or anomalous.
- Autoencoders and BiLSTM-autoencoder hybrids, trained only on normal drilling data, that flag a kick when reconstruction error spikes — useful because true kicks are rare and hard to label exhaustively.
- LSTM networks, which capture the temporal dependency between pump rate, SPP, and flow-out that a single-instant threshold simply can’t see.
- Temporal convolutional networks and deep-forest models, applied to the closely related problem of lost-circulation forecasting, with reported accuracy above 93.7% against field-validated datasets.
What all of these have in common is that they operate on engineered features — rolling statistics of ΔQ, pit-gain rate of change, standpipe pressure trend — rather than raw instantaneous values. That’s the same principle a good driller already uses intuitively: it’s not the single data point that matters, it’s whether today’s trend looks like yesterday’s normal.

A Worked Example: A Rolling Z-Score Detector in Python
You don’t need a research lab to get a feel for this. A rolling z-score on delta flow is the simplest possible anomaly detector, and it already outperforms a static threshold because it adapts to each well’s own noise level instead of assuming one global cutoff. Here’s a compact version you can run against your own historian export:
import numpy as np
import pandas as pd

def rolling_zscore_kick_flag(delta_flow, window=60, z_threshold=3.0):
    """
    delta_flow: pandas Series of Qout - Qin (gpm), sampled at a fixed rate
    window: rolling window length in samples (e.g. 60 samples ~ 1 minute at 1 Hz)
    z_threshold: number of std devs above the rolling mean to flag as anomalous
    """
    roll_mean = delta_flow.rolling(window, min_periods=window).mean()
    roll_std = delta_flow.rolling(window, min_periods=window).std()
    z = (delta_flow - roll_mean) / roll_std.replace(0, np.nan)
    flag = z > z_threshold
    return z, flag

# Example usage on a historian export
df = pd.read_csv("drilling_flow_log.csv", parse_dates=["timestamp"])
df["delta_flow"] = df["flow_out_gpm"] - df["flow_in_gpm"]
df["z_score"], df["kick_flag"] = rolling_zscore_kick_flag(df["delta_flow"])

first_flag = df.loc[df["kick_flag"], "timestamp"].min()
print(f"First anomaly flagged at: {first_flag}")
In production systems this rolling z-score is usually the first stage of a pipeline, not the final answer — it’s cheap to compute in real time and catches the obvious cases, while an LSTM or autoencoder running in parallel picks up subtler, multivariate patterns (a small ΔQ rise combined with a WOB anomaly, say) that a single-variable z-score will always miss. Corva’s real-time drilling platform is a good example of this layered approach running in production across shale and offshore rigs, pulling live WITSML data and applying exactly this kind of anomaly scoring before it ever reaches the driller’s screen.
The Payoff: Minutes You Can Actually Use
Minutes matter more than they sound like they should. Once an influx is confirmed, the crew has to stop the pumps, check flow, shut in the well, and read shut-in casing and drillpipe pressures before starting a kill procedure — and every one of those steps takes longer if the kick has already grown from a 5-barrel event into a 40-barrel one. Detecting the same influx even 10 to 15 minutes earlier changes the size of the problem the crew is solving, not just the time they have to solve it.
How to Verify It’s Working, and Where It Still Fails
Before trusting any anomaly model on a live well, run it against a library of historical kicks and known false alarms from your own field — including trip-tank transfers, connections, and rough-sea false positives — and confirm the flagged timestamp always lands before the conventional pit-gain alarm, never after. A model that only matches the old alarm hasn’t earned its keep.
Three pitfalls show up repeatedly in the field:
- Gas that stays dissolved. Under high bottomhole pressure, especially in oil-based mud, influx gas can remain in solution and simply won’t show up as a pit-gain or gas-cut signature until it expands much higher in the wellbore — no surface algorithm can catch what hasn’t reached surface yet.
- Rig-motion noise on floaters. Heave-compensated pit sensors reduce this, but any model trained on a fixed rig will need retuning before it’s trusted on a moving one.
- Silent connections. Pumps-off periods are exactly when flow-based detection goes dark; this is the strongest argument for wired drill pipe or downhole pressure-while-drilling sensors on high-pressure wells, since no amount of surface-data cleverness restores a signal that was never transmitted.
None of this replaces well-control training or a properly designed kill sheet — see our step-by-step guide to automating kill sheet calculations in Python for the next stage of the same problem. AI anomaly detection simply buys the crew the one thing that no amount of procedure can: an earlier start. Pair it with the kind of drilling-anomaly work we covered in stuck-pipe prediction with machine learning and our directional-survey automation tutorial, and the same real-time data pipeline starts paying for itself several times over across the well plan.
