

By Saad Iqbal
Pull up the thermal camera feed on almost any flare stack at 2 a.m. and you will see the same thing: a yellow-orange plume that looks fine to the naked eye but is quietly failing its combustion efficiency target. Nobody is standing at the base of the stack with a stopwatch and a pair of binoculars anymore — and even if they were, Method 22 only asks whether smoke is visible, not whether the gas is actually being destroyed. That gap between “looks clean” and “burns clean” is exactly where AI flare monitoring tools have gone from a nice-to-have to something regulators, insurers, and reservoir engineers all now check before a well pad goes live.
This post compares the AI flare monitoring tools upstream operators are actually buying in 2026, explains the EPA math your flare has to clear, and gives you a Python script to flag a bad burn from field data before the camera even tells you.

Why Flare Combustion Efficiency Became an AI Problem
Every assisted or unassisted flare in the U.S. is still governed by the same federal backbone rule, 40 CFR 60.18, and the numbers in it are unforgiving. Steam- or air-assisted flares need a net heating value of at least 300 Btu/scf; non-assisted flares need at least 200 Btu/scf. Exit velocity has to stay below 60 ft/s by default, though a flare burning gas above 1,000 Btu/scf can run as fast as 400 ft/s. A pilot flame must be present at all times, watched by a thermocouple or equivalent sensor, and under EPA Method 22 a flare is allowed no more than 5 minutes of visible smoke in any 2 consecutive hours of observation.
EPA’s newer New Source Performance Standards for the oil and gas sector (NSPS OOOOb) push past that: operators now have to demonstrate and maintain roughly 98% combustion efficiency on covered flares, not just avoid visible smoke. That is a much harder number to prove with a human and a logbook. Combustion efficiency swings with wind shear, gas composition, liquid carryover, and flow rate — all of which change faster than a quarterly inspection can catch. That is the opening AI walked into: continuous, camera-based combustion-efficiency monitoring that scores every minute of flare operation instead of one 2-hour snapshot a year.
What “AI” Actually Means in a Flare Monitoring Camera
None of the tools below are guessing. They point an infrared or multispectral imager at the flare tip and run the pixel data through a trained model that estimates combustion efficiency from flame shape, soot signature, and the spectral fingerprint of unburned hydrocarbons escaping the plume — the same physics an experienced flare operator uses when they say a flame “looks lazy,” just quantified and run continuously instead of on a walk-by. The output is a number, logged every few seconds, that you can trend against wind speed, gas rate, and steam-to-gas ratio to find the actual cause of a bad burn instead of guessing.

Best AI Flare Monitoring Tools Compared
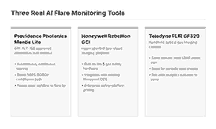
1. Providence Photonics Mantis & Mantis Lite
Providence Photonics built its business on flare imaging and it shows: Mantis is a standalone, autonomous camera system that watches flare performance remotely and continuously, using the same multispectral infrared approach behind the company’s long-running VISR (Video Imaging Spectral Radiometry) method. The detail that matters most for a compliance engineer: Mantis Lite, the lower-cost version aimed at continuous monitoring, has been approved by EPA as Alternative Test Method ALT-156 for demonstrating combustion efficiency compliance under NSPS OOOOb. That is not a marketing claim — it is a specific EPA approval number you can cite to your regulator.
- Best for: operators who need an EPA-recognized alternative to periodic manual testing
- Watch for: camera placement and sightline to the flare tip — occlusion kills accuracy the same way it does with a human observer
2. Honeywell Rebellion Gas Cloud Imaging (GCI)
Honeywell’s Rebellion GCI cameras started life doing hydrocarbon gas-cloud detection for fire-and-gas safety systems after Honeywell acquired Rebellion Photonics, and the same hyperspectral imaging core now gets pointed at flare tips for combustion and emissions work. Because it was built as a safety instrument first, it integrates cleanly into existing fire-and-gas and DCS networks that already trust Honeywell hardware, which matters if your site’s instrumentation standard is already Honeywell-based.
- Best for: sites that want flare monitoring folded into an existing gas-detection and safety-instrumented system rather than bolted on separately
- Watch for: it is priced and supported as an enterprise safety platform, not a point sensor — budget accordingly
3. Teledyne FLIR GF320 Optical Gas Imaging Camera
The FLIR GF320 is the handheld workhorse most LDAR crews already own for leak surveys, and it doubles as a fast, portable way to visualize hydrocarbon vapor and flame structure around a flare without a permanent installation. It is not an autonomous, continuously-scoring AI system the way Mantis or Rebellion GCI are — the AI layer comes from whichever fleet-management or analytics software you pair it with — but for operators who need occasional, verifiable optical gas imaging on a flare that does not justify a permanent camera, it is the realistic entry point.
- Best for: smaller pads and periodic verification rather than 24/7 continuous scoring
- Watch for: you are buying a camera, not a combustion-efficiency algorithm — pair it with analytics software if you want trending
Build a Flare Health Flag Before You Buy a Camera
You do not need a camera to catch the easiest-to-miss failure mode: a flare quietly drifting below its minimum net heating value as associated gas composition changes with reservoir depletion or a new high-water-cut well coming online. If you are already logging gas rate, net heating value, and steam (or air) assist rate in your SCADA historian, you can flag an exit-velocity violation against 40 CFR 60.18 in a few lines of pandas and get an early warning days before a compliance test would catch it.
import pandas as pd
import numpy as np

# df columns: timestamp, gas_rate_scfh, stack_diameter_in, net_heating_value_btu_scf, assisted (bool)
def exit_velocity_fps(gas_rate_scfh, stack_diameter_in):
    area_ft2 = np.pi * (stack_diameter_in / 24) ** 2  # diameter(in) -> radius(ft)
    scfs = gas_rate_scfh / 3600
    return scfs / area_ft2

def min_nhv(assisted: bool) -> float:
    return 300.0 if assisted else 200.0

def velocity_limit_fps(nhv_btu_scf: float) -> float:
    # 40 CFR 60.18 default and high-Btu allowance, ft/s
    if nhv_btu_scf > 1000:
        return 400.0
    return 60.0

df["v_exit_fps"] = exit_velocity_fps(df["gas_rate_scfh"], df["stack_diameter_in"])
df["nhv_min_required"] = df["assisted"].apply(min_nhv)
df["v_limit_fps"] = df["net_heating_value_btu_scf"].apply(velocity_limit_fps)

df["nhv_violation"] = df["net_heating_value_btu_scf"] < df["nhv_min_required"]
df["velocity_violation"] = df["v_exit_fps"] > df["v_limit_fps"]
flags = df[df["nhv_violation"] | df["velocity_violation"]]

print(f"{len(flags)} of {len(df)} readings outside 40 CFR 60.18 limits")
print(flags[["timestamp", "net_heating_value_btu_scf", "v_exit_fps"]].tail(10))
Run that nightly against your historian export and you get a free, continuous proxy for combustion risk — not a replacement for a camera-based system if you are subject to NSPS OOOOb’s 98% efficiency demonstration, but a real early-warning layer that costs you an afternoon instead of a procurement cycle.
Common Pitfalls When You Roll This Out
- Camera sightline, not camera quality, is usually the failure point. A Mantis or Rebellion GCI unit aimed at the wrong angle, or partially blocked by a derrick, piping, or a neighboring flare, will silently degrade its combustion-efficiency estimate the same way an occluded human observer would under Method 22 — check the sightline before you trust the number.
- High wind shear is the scenario every vendor demo skips. Wind can bend the flame away from the assist steam or air, dropping combustion efficiency even when the gas rate and heating value look fine on paper — make sure whichever system you pick logs wind speed alongside its efficiency score so you can tell a real combustion problem from a windy afternoon.
- Liquid carryover fouls the read. Slugs of condensate or produced water reaching the tip will smoke and throw off both a human Method 22 observation and most camera-based efficiency estimates — if you are seeing intermittent low-efficiency flags, check your separator and scrubber performance before you blame the flare tip.
- Continuous monitoring data is worthless without a retention plan. If the point of the system is defending an NSPS OOOOb compliance demonstration, confirm up front how long the vendor retains raw imagery and efficiency logs, and make sure that matches your state and federal recordkeeping requirements.
How to Pick Between Them
- Need an EPA-recognized compliance pathway today? Mantis Lite’s ALT-156 approval is the most direct route under NSPS OOOOb.
- Already standardized on Honeywell for gas detection? Rebellion GCI folds flare monitoring into instrumentation your control room already trusts.
- Running LDAR surveys anyway? A GF320 you already own earns its keep as an occasional flare check before you fund a permanent camera.
- Low-budget or single-well pad? Start with the pandas script above against your existing SCADA tags, and upgrade to hardware once the data tells you where the risk actually is.
Whichever tool you land on, the goal is the same: catch a drifting flare on a Tuesday afternoon instead of during a regulator’s site visit. For the chemistry behind why gas composition drifts in the first place, read the related tutorial on AI souring prediction and H2S breakthrough, and for the fugitive-emissions side of the same wellpad, see our comparison of AI methane monitoring tools for upstream O&G.
