
The string stops moving at 4:40 a.m., twenty minutes after the shift change nobody flagged as a risk window. Torque is climbing, overpull on the last few connections has crept past what the driller would normally call normal, and now the string just won’t come free. Three hours later, after working pipe and pumping a spotting fluid, it’s loose again — but the rig has burned a day rate’s worth of time on an event that, on paper, every trend on the screen was quietly pointing to an hour before it happened. Nobody was ignoring the data. Nobody was watching the right combination of it, either.
Stuck pipe prediction is one of the oldest problems in drilling and one of the best-suited to AI, precisely because the warning signs are real, physical, and almost always present in the data stream well before the string actually stops. The trouble has never been a lack of data. It’s that no driller can watch six correlated trends at once, at 4 a.m., across every connection, for an entire well.
By Saad Iqbal. I write about the places where AI and better real-time data change an operator’s actual decisions, not just their dashboards. This one is about differential sticking specifically — what causes it, what an AI model actually watches for, and where that model still needs a driller’s judgment to act on the alert.
The Problem That Still Costs the Industry Hundreds of Millions a Year
Stuck pipe has been studied hard enough, for long enough, that the historical numbers are uncomfortably precise. An industry task force’s review of North Sea and Gulf Coast drilling in the late 1980s, published in Oil & Gas Journal, found stuck-pipe incidents running $170,000 per well on average across the study period, with industry-wide costs estimated at more than $250 million a year even then — and that review is still cited in modern stuck-pipe literature because the underlying mechanics haven’t changed, only the day rates have gotten more expensive. The same study broke the mechanism down by region: differential sticking accounted for roughly 61% of Gulf Coast incidents versus 29% in the North Sea, where mechanical sticking and packed-off holes dominated instead. And the timing breakdown is the part that should make every rig site pay attention to shift handover specifically: about 50% of incidents happened while tripping, 40% while the string sat stationary, and only 10% while actually drilling on bottom — with roughly a third of all incidents clustering in the two-hour window around a crew change.
That last number is the real tell. Stuck pipe isn’t random bad luck. It concentrates at exactly the moments when the string is least monitored and least actively managed — stationary, mid-trip, or handed from one crew’s mental model of the well to another’s. That’s an operational pattern, and operational patterns are exactly what machine learning is good at catching before a human notices the trend.
The Physics Behind a Stuck String
Differential sticking, the mechanism this piece focuses on, happens when the drill string sits motionless against a permeable formation with a filter cake built up on the wellbore wall. Wellbore hydrostatic pressure in an overbalanced mud system is higher than the pore pressure in that permeable zone, so mud filtrate leaks off into the formation and leaves a thin cake of solids plated against the wall. If the pipe happens to be lying against that cake when it stops moving, the pressure differential across the filter cake acts over the pipe’s contact area, pressing it into the wall hard enough that friction alone can exceed anything the rig’s hoisting capacity can overcome.

The sticking force scales, approximately, with the pressure differential across the cake multiplied by the pipe-to-wall contact area and a friction coefficient that depends on mud type and cake thickness. None of those three variables are fixed: overbalance grows as mud weight is raised to control an unrelated well-control concern, contact area grows with hole angle and the length of time the pipe sits still letting the cake thicken further, and the friction coefficient worsens with poor mud lubricity. That’s exactly why differential sticking risk isn’t a constant — it’s a trend that builds, measurably, in the minutes and hours before the string actually locks up.
What an AI Model Actually Watches For
Real-time stuck-pipe models, including the hybrid physics-plus-machine-learning approaches described in recent SPE and industry drilling-systems research, don’t look for one dramatic red flag. They watch the correlated drift across several channels at once, which is exactly the pattern a tired driller at the end of a twelve-hour tour is least equipped to track across every one of them simultaneously:
- Overpull and drag trend. A gradually rising pull needed to move the string on each successive connection, even before it’s large enough to alarm on its own, is often the earliest leading indicator.
- Torque behavior while rotating off bottom. Rising torque with no corresponding change in weight on bit points at friction building against the wall rather than cutting rock.
- Static time since last movement. Differential sticking risk compounds with every minute the pipe sits still across a permeable, overbalanced interval — a variable platforms like Corva track explicitly as part of real-time drilling risk scoring, since it’s visible in rig time data that every well already generates.
- Mud weight versus pore pressure margin. Overbalance that’s wider than the well plan assumed, often from a mud weight increase made for a separate well-control reason, raises differential sticking risk on every permeable zone the string crosses afterward.
- Equivalent circulating density (ECD) and cuttings loading trends. Rising ECD from accumulating cuttings or barite sag changes the effective overbalance the same way a deliberate mud weight increase does, just less visibly.
A simplified version of the leading-indicator logic, run on time-series drilling data that’s already being logged, looks like this in Python:
import pandas as pd

# df: time-indexed drilling data with overpull, torque,
# and minutes since the string last moved
df["overpull_trend"] = df["overpull_klbs"].rolling("30min").mean().diff()
df["static_minutes"] = df["minutes_since_movement"]

risk_flag = (
    (df["overpull_trend"] > 0)
    & (df["static_minutes"] > 15)
    & (df["torque_pct_baseline"] > 1.15)
)

df["differential_sticking_risk"] = risk_flag
print(df.loc[risk_flag, ["time", "overpull_klbs", "static_minutes"]])
That’s a deliberately simplified version of the hybrid physics-informed models described in current drilling-systems research, which combine this kind of trend detection with a sticking-force calculation from the actual mud and wellbore geometry rather than fixed thresholds alone — but the underlying principle is one any drilling data team can prototype against their own rig’s historical connection and trip data before buying anything.
From Alert to Action
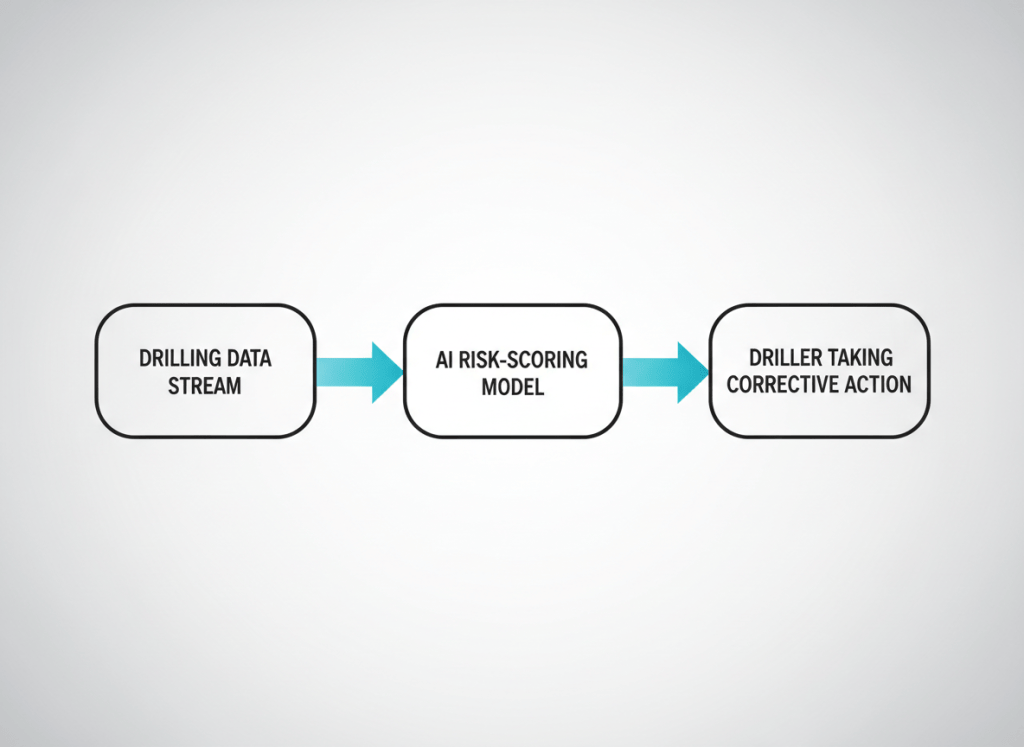
An alert that doesn’t change what the driller does next is just noise with better branding. In practice, a rising differential-sticking risk score changes a handful of concrete decisions: working the string more frequently during planned stationary periods instead of leaving it dead in the hole, shortening the interval between reciprocation during logging or surveys across a known permeable zone, flagging the next connection for extra lubricant or a mud-weight review if overbalance is running wider than planned, and — the cheapest fix of all — simply briefing the incoming crew on a live risk trend at shift change instead of handing over a well that looks, on paper, identical to how it did eight hours earlier.
Differential sticking isn’t the only mechanism worth watching for, either. Mechanical sticking from packed-off hole or key-seating shows up in a different combination of torque and drag signatures, and often overlaps with the kind of hole-cleaning and cuttings-loading problems covered in our explainer on AI lost circulation detection — a well that’s losing fluid is frequently the same well where cuttings aren’t being cleaned out of the annulus properly, which raises both lost-circulation and packed-off-hole risk together. And torsional behavior that looks superficially similar on a torque trend — but is actually stick-slip vibration rather than a sticking string — is its own distinct failure mode, covered in our piece on AI stick-slip detection.
Where the Models Still Struggle
Two limits are worth stating honestly. First, these models are trained and calibrated on historical connection and trip data that varies enormously by rig, mud system, and formation — a threshold tuned on one basin’s shale sequence can under- or over-alarm badly in a different lithology, so rig-specific or at least play-specific calibration isn’t optional. Second, the hardest cases are the ones where two mechanisms overlap — differential sticking compounded by a partially packed-off hole, say — and separating which driver to treat first still depends on a driller or drilling engineer reading the whole picture, not just the model’s single risk number. The tool is a better set of eyes on the data stream. It isn’t a replacement for the judgment of whoever’s actually working the string at 4 a.m.
Practical Takeaways
- Differential sticking concentrates heavily around stationary pipe and trips, with roughly a third of historical incidents clustering around shift change — brief the incoming crew on the live risk trend, not just the static well plan.
- Watch overpull trend, torque behavior off bottom, static time since last movement, and overbalance together; any one of them alone is a weak signal, but the combination trending the same direction is not.
- Rising ECD from cuttings loading or barite sag increases differential sticking risk the same way a deliberate mud weight increase does — track it as part of the same risk picture, not a separate hydraulics problem.
- Calibrate any threshold-based model against your own rig and formation’s historical data before trusting it; a model tuned elsewhere can alarm at the wrong sensitivity for your wellbore.
- Treat the model’s output as a prioritized worklist for the driller — work the string more often, adjust lubricity, review mud weight — not as an automatic decision.
The data that predicts a stuck string is almost always already on the rig floor’s screens. What AI actually changes is whether anyone is watching all of it, correlated, continuously, at four in the morning, instead of catching the trend only after the string has already stopped moving.
