

DrillAstra brings daily drilling reports, NPT events, cost assumptions and engineering evidence into one reviewable workflow. Built by EnergyMindAI, it helps drilling teams move from a list of interruptions to a structured investigation: what happened, how much effective time it consumed, where patterns appear, and what evidence should be examined next.
A drilling report can tell you that a pump failed. A spreadsheet can add up the hours. The harder questions arrive in the morning meeting. Did two entries describe the same elapsed interval? Was the activity planned? Which denominator produced the NPT percentage? Is the equipment category supported by the original narrative? Does the suggested cause have inspection evidence behind it? DrillAstra makes these questions visible rather than burying them inside an unexplained total.
This illustrated guide takes you through a complete two-well demonstration, from upload and validation to the category Pareto, event investigation, Engineering Copilot and follow-up actions. You will see actual screenshots from the hosted tool, the results generated from the example files, and a practical method for analysing the challenges those results reveal.
Request a free guided demo: contact partnerships@energymindai.com or visit the DrillAstra product page. Tell EnergyMindAI whether you want to explore historical NPT analysis, offset-well learning, rig readiness or advisory sensor replay. Demo access is arranged by the team; there is no public self-service signup assumed in this walkthrough.
Read the demonstration correctly. Every operational record used here is synthetic and explicitly labelled. These are training examples, not measurements from a client well. The screenshots show the real application running those examples. The cover is an AI-generated brand illustration, not a photograph of a participating rig. USD 33,750 below is calculated exposure under chosen assumptions; it is not a verified invoice, an achieved saving or a promise of future performance.
The headline result: 19 imported operational records across two synthetic wells produced 96 logged well-hours, 71 productive hours, 10 planned non-drilling hours and 15 effective NPT hours. DrillAstra displayed 15.62% NPT and estimated USD 33,750 of NPT exposure. A deliberate one-hour overlap explains why the effective NPT total is lower than the 16 hours obtained by simply adding the reported interruption durations.
Table of Contents
1. DrillAstra starts with a defensible definition of time
NPT analysis is only useful when the team agrees on what the time labels mean. A planned casing preparation activity and an unexpected equipment interruption should not become the same kind of downtime merely because neither record says “drilling.” DrillAstra separates productive time, planned non-drilling time and unplanned NPT, then retains the original source label alongside the reviewed classification.
Productive time covers the activities your approved reporting policy treats as productive. Planned non-drilling time covers intended activities that are part of the programme but are not classified as productive drilling in that policy. Unplanned NPT covers interruptions classified as unplanned loss of operational time. The policy must be agreed for your campaign; a keyword or a coloured bar cannot replace the approved operational context.
That distinction changes the conversation. If planned maintenance appears in an NPT Pareto, the team may spend its improvement effort explaining work that was intended. If an unplanned service delay is treated as planned because it occurred during a transition, the report may hide a recurring coordination issue. DrillAstra gives reviewers a place to correct the classification and record the reason, while preserving the source material.
NPT is also only one part of the total well-time picture. Slow execution within an otherwise productive activity can require a separate performance study. An SLB technical paper on invisible lost time discusses the wider opportunity in improving ROP and reducing flat time. The NPT walkthrough here does not claim that every such inefficiency has been detected. It establishes a reliable interruption ledger that can support later performance work.
For a first DrillAstra session, write a short classification policy before importing anything. Decide how your organisation treats connections, planned maintenance, casing preparation, waiting on services and weather interruptions. Record who can approve changes. Doing this first makes disagreements useful: the review can address a stated rule rather than an undocumented interpretation.
2. Explore the DrillAstra workspaces as one engineering workflow
DrillAstra is organised around distinct workspaces so that evidence, calculations and decisions remain understandable. NPT Intelligence is the starting point for DDR imports, downtime accounting, searchable event records and campaign charts. Wells & rigs and Campaigns establish the operational structure and economic assumptions behind those results.
Offset-Well Intelligence supports historical comparison, lessons and sourced parameters. Rig Readiness brings equipment, crew, materials, certification and services into a review workflow, alongside the engineering action queue. Engineering Copilot searches uploaded documents and presents exact supporting excerpts for review.
The broader modular platform also includes Stuck Pipe Guardian, Drilling Hydraulics, Drilling Performance and Equipment Reliability, with Alert Logic & Replay available for retrospective rule evaluation. These workspaces should be approached with the inputs and validation each task requires. Merely opening a module does not create measured torque, pressure, ROP, MSE or ECD data.
This guide demonstrates the historical NPT workflow in depth, then shows evidence search, offset comparison, investigation actions and synthetic alert replay. It does not present the engineering modules as a commissioned live rig service. The practical benefit is a common review environment: a cost signal can lead to a source record, a source record can lead to an investigation, and an accepted investigation can lead to follow-up work.
For a drilling engineer, this creates a traceable technical review. For a superintendent, it creates an understandable summary of time and exposure. For a reliability specialist, it creates a starting list of interruptions that need maintenance evidence. For a campaign manager, it makes comparisons more transparent. The same numbers can serve these audiences because their assumptions and source records are visible.
3. Create the campaign, rig and wells before uploading a report
Our live example uses a campaign named DrillAstra article demo — SYNTHETIC, a rig named Astra demo rig — SYNTHETIC, and two wells: ASTRA-DEMO-A and ASTRA-DEMO-B. The field description identifies the records as a synthetic article example. No measured well depth, formation profile or rig specification is invented to make the charts look complete.
Set up your real workspace in the same order. Create the campaign, confirm the reporting currency and costing basis, add the rig, then add the wells associated with it. Check spelling and identifiers against your reporting system. A good well name is more than a dashboard label: it determines where the imported operations, source documents and subsequent review records belong.
For this demonstration we configured USD 48,000 per day for rig time and USD 250 per hour of additional exposure. We selected All logged time as the NPT denominator. These inputs are illustrative assumptions chosen to explain the calculations. They do not represent a contract or the economics of a particular operator.
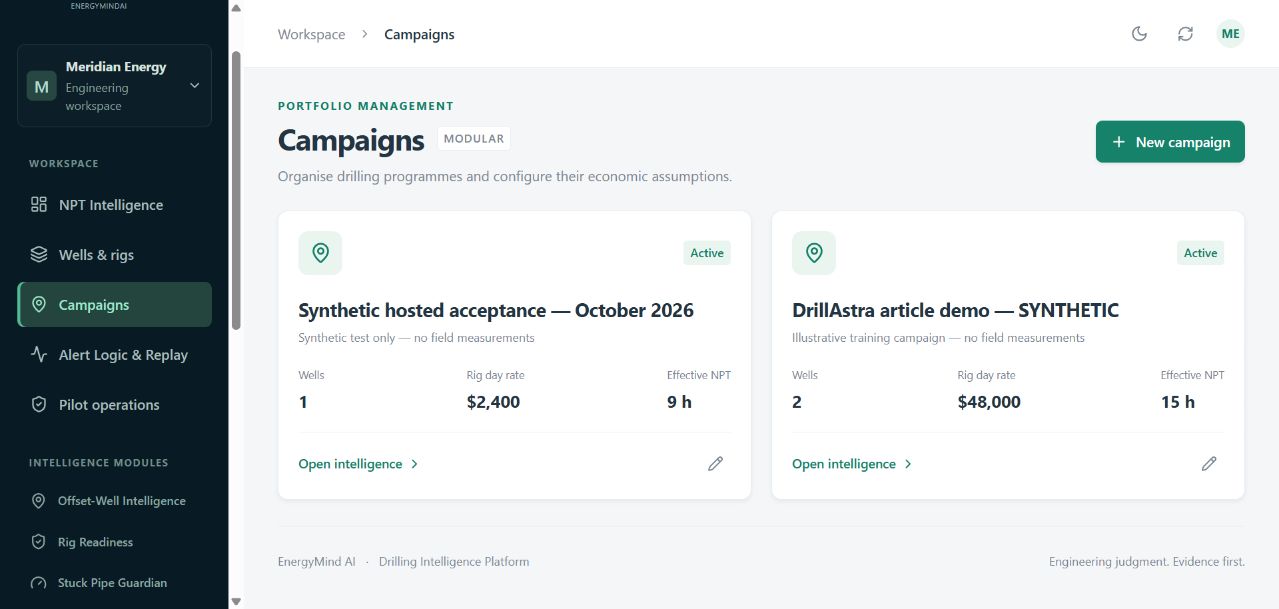
Before using real cost figures, reconcile what the day rate includes. If standby equipment, services or crew charges are already in the contract rate, adding them again as a separate hourly input would overstate exposure. Conversely, an intentionally narrow rig-time estimate may exclude other consequences. State the scope in the report so readers know what the figure measures.
Campaign totals also need an interpretation rule. This example has sequential operations on one synthetic rig, so its 96 logged well-hours fit a 96-hour operational window. In a campaign with multiple wells and rigs operating in parallel, summed well-hours can exceed elapsed calendar hours. DrillAstra comparisons should therefore be read as the configured operational accounting measure, not automatically as a single calendar duration.
4. Prepare and upload DDR or NPT logs
DrillAstra accepts CSV, XLSX and structured text PDF imports. For the clearest first demonstration, start with a tidy CSV containing one operational record per row. The example files use start time, end time, description, time kind and category. Each narrative begins with SYNTHETIC ARTICLE DEMO, making the nature of the data visible even after export.
ASTRA-DEMO-A contains 11 operational rows covering 4–6 October 2026 UTC. ASTRA-DEMO-B contains eight rows covering the next 48 hours, 6–8 October UTC. These records include productive periods, planned preparation and maintenance, equipment interruptions, service waiting, losses, a stuck-pipe-labelled interruption and wellbore instability. They are realistic reporting situations used for training; the narratives do not establish the physical mechanisms behind them.
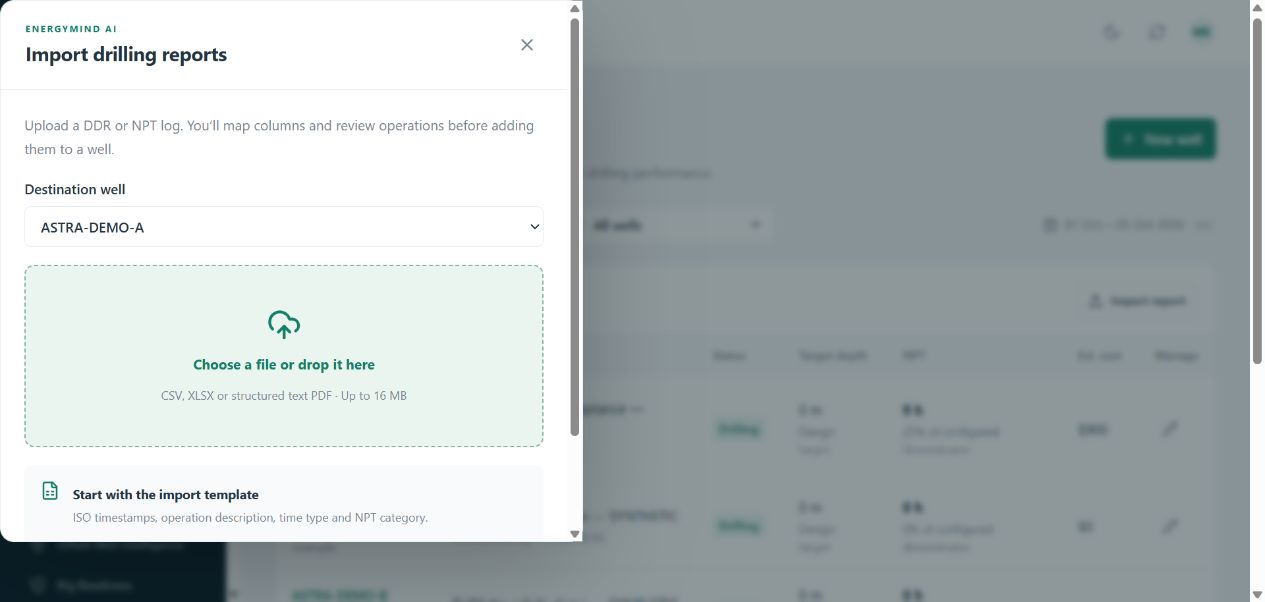
Open DrillAstra NPT Intelligence, choose the import action, select the destination well and upload the source. Review the proposed column mapping instead of assuming that a familiar header means the correct field. A field called “hours” may be a reported duration rather than an end timestamp. A field called “activity” may contain a code rather than the description you want preserved.
Confirm the timezone explicitly. Midnight boundaries, local shift reporting and daylight-saving changes can distort durations when the source convention is unclear. The demonstration uses explicit UTC timestamps, so the reader can follow every interval without conversion. For a real import, agree the source timezone with the report owner and check at least one known start and end against the original report.
PDF imports deserve particular attention. A structured text PDF can provide extractable content; a scanned image may require OCR before import. Inspect the resulting operational rows against the document. An OCR error in a timestamp or a lost table column is a validation issue, not evidence that the rig performed an activity differently.
Good preparation is not about perfecting every historical file before starting. It is about protecting meaning. Keep the original file, make the mapping explicit, preserve narratives and let the review identify exceptions. That makes the import repeatable and makes later disagreement easier to resolve.
5. Validate the import and resolve issues before committing
The first synthetic file produced 11 usable rows, zero blocking errors and one overlap warning. We deliberately retained that warning because it is central to the worked example. The pump interruption runs from 10:00 to 13:00, while waiting on backup-pump mobilisation runs from 12:00 to 14:00 on the same well. Both source descriptions need to remain visible.
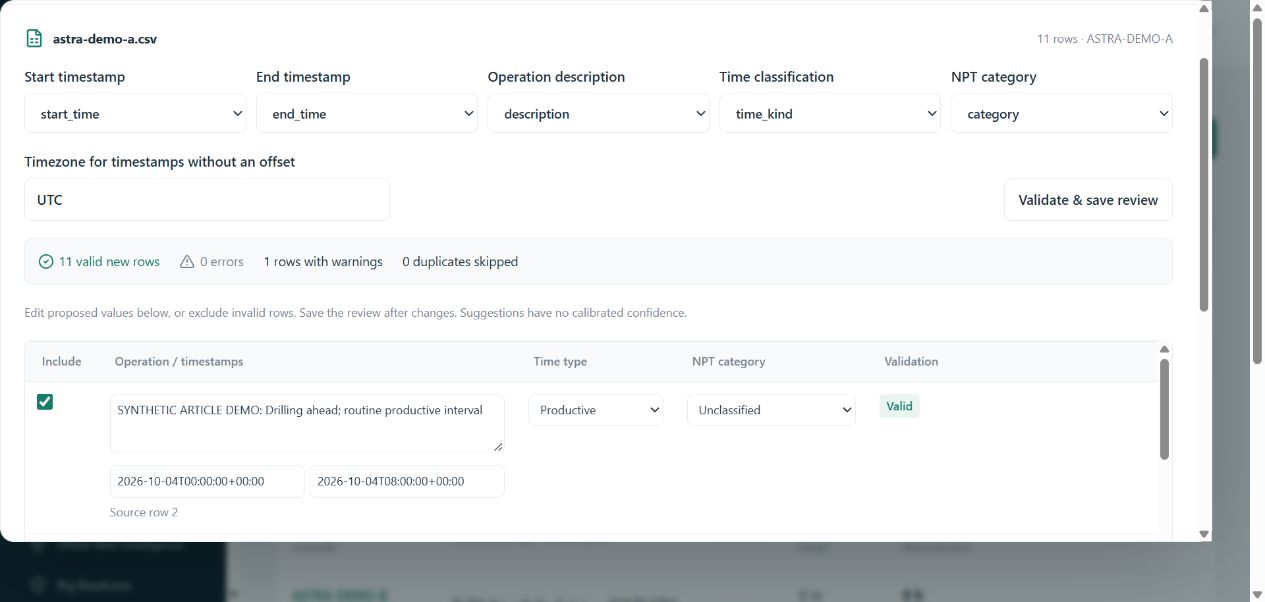
A second useful safeguard appeared while preparing the example. An initial version of well B placed its operations at the same time as well A on the same rig. The importer blocked the rows with a cross-well rig scheduling conflict. We corrected the source timestamps so that B followed A, then uploaded the corrected file. Its eight rows passed without errors or warnings.
This is the kind of check that matters in a busy engineering workflow. A destination-well mistake or copied date range can produce plausible charts while representing an impossible rig schedule. Validation provides a chance to correct the operational context before those rows become part of the campaign ledger.
Work through the import review deliberately. Check a representative productive row, a planned row and each NPT row. Examine the flagged exceptions. Confirm the mapping, timezone and classifications required by the import screen. If the narrative is ambiguous, preserve the ambiguity in the review rather than adding an unsupported explanation.
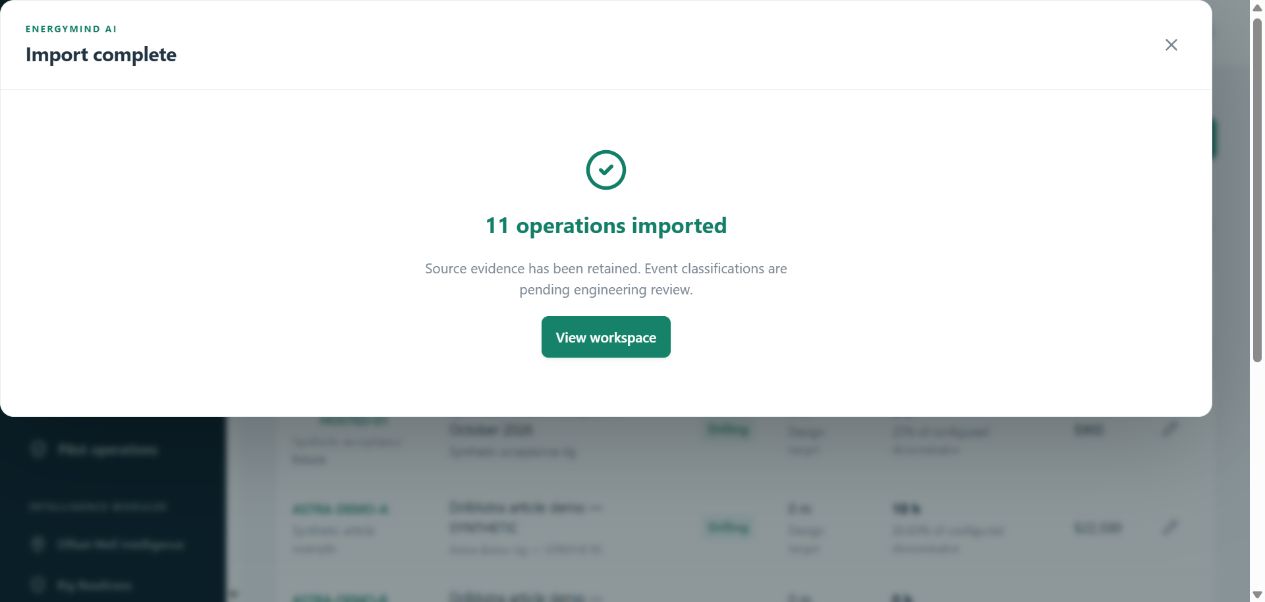
At the initial campaign checkpoint, all 19 imported classifications awaited review. Later in this walkthrough we review one pump classification and one advisory. That change in status is meaningful, but it does not make the remaining records reviewed. Keep the distinction between a successfully imported dataset and an approved engineering interpretation visible in every report.
6. Read the dashboard: the demonstrated NPT results
With both corrected files imported, we selected the synthetic campaign in NPT Intelligence. The DrillAstra dashboard showed two wells, 96 logged hours, 15 effective NPT hours and a displayed NPT share of 15.62%. The compact exposure card rounded the amount to approximately USD 33.8K; the downloaded report retained the exact total of USD 33,750.
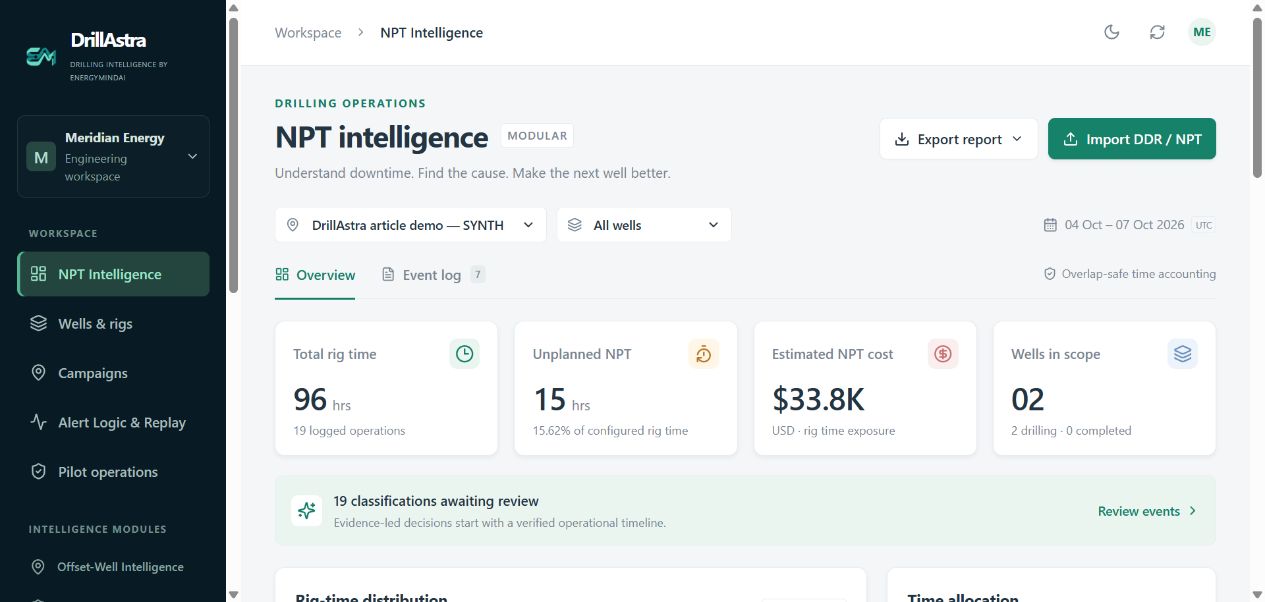
| Measure | Synthetic demonstration result | How to interpret it |
|---|---|---|
| Operational records | 19 across two wells | Imported records, not 19 independent failures |
| Logged time | 96 hours | Effective logged well-time in the selected campaign |
| Productive time | 71 hours | Time classified as productive under the example policy |
| Planned non-drilling | 10 hours | Included in the selected denominator |
| Effective unplanned NPT | 15 hours | After overlap resolution |
| Displayed NPT share | 15.62% | 15 / 96 × 100, rounded by DrillAstra |
| Estimated NPT exposure | USD 33,750 | 15 hours × USD 2,250 per hour |
The arithmetic is transparent. Rig time costs USD 48,000 / 24 = USD 2,000 per hour under the chosen assumption. Adding USD 250 per hour produces USD 2,250 per NPT hour. Multiplying by 15 effective NPT hours gives USD 33,750. The exact NPT percentage is 15.625%; DrillAstra displays 15.62% using its rounding convention.
Now separate three questions. Hours describe the effective time classified as NPT. Percentage describes those hours relative to a selected denominator. Exposure translates the hours using a cost assumption. A change in denominator can alter the percentage without changing the NPT duration or its calculated exposure.
For example, excluding the ten planned hours would use 86 hours as the denominator. The same 15 NPT hours would then be approximately 17.44%. This is a transparent recalculation for explanation, not the setting shown in the dashboard screenshot. Neither percentage is automatically the correct policy for every organisation; comparisons require a common, stated basis.
Use the dashboard as a starting map. The time breakdown tells you whether productive, planned and unplanned time reconcile. The daily trend shows where to inspect the timeline. The category Pareto identifies concentration. The well comparison reveals where to ask about context. Each chart supports a different question, and none alone proves why the interruption happened.
7. Understand why overlap handling changes the result
The overlapping pump and service records provide the most instructive calculation in the demonstration. The pump row reports three hours, from 10:00 to 13:00. The mobilisation row reports two hours, from 12:00 to 14:00. Adding the reported durations gives five hours, but the rig-time interval from the first start to the last end is only four hours.
DrillAstra resolves overlaps when calculating effective time. Its displayed policy applies unplanned, planned and productive priority in that order. Equal-priority conflicts are allocated by a stable event ID. This provides deterministic accounting; it does not determine causal responsibility, contractual allocation or which interruption physically prevented progress.
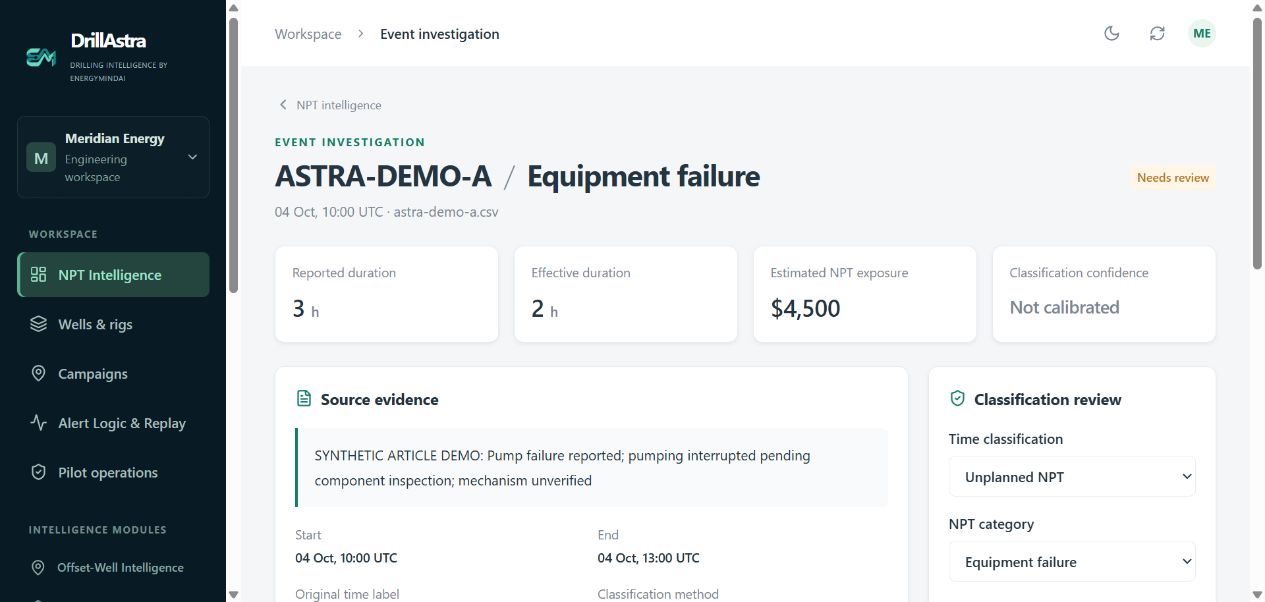
In this saved dataset, the pump row receives two effective hours and USD 4,500 of exposure. The service row receives two effective hours and another USD 4,500. Together they account for four elapsed NPT hours and USD 9,000 under the configured rate. The original three-hour pump narrative is still available for investigation.
Across the campaign, naive addition would produce 16 reported NPT hours and USD 36,000. The effective calculation produces 15 hours and USD 33,750. The USD 2,250 difference is an avoided accounting overstatement in this example. It is not an operational saving: no actual rig hour was recovered by changing the calculation.
This also reveals a challenge in category analysis. Total elapsed downtime can be sound while attribution remains debatable. If pump restoration and backup mobilisation occurred simultaneously, which delay should receive the shared hour for management reporting? That requires the approved policy and operational evidence. The software keeps the conflict reviewable; engineers still have to reconcile the story.
When examining overlaps in your own dataset, ask whether the records describe parallel work, duplicate reporting, a handover boundary or a genuinely incorrect timestamp. Compare the source rows with the shift report and responsible personnel. Do not delete a useful narrative simply because another record covers part of the same interval.
8. Use the NPT Pareto to choose an investigation order
The DrillAstra Pareto ranks categories by effective NPT hours and overlays a cumulative share. In the synthetic campaign, logistics and services and lost circulation each contribute four hours. Equipment failure contributes three, while stuck pipe and wellbore instability contribute two hours each. These five categories reconcile to the 15-hour effective total.

| Category | Effective NPT | Estimated exposure | NPT records | Cumulative share |
|---|---|---|---|---|
| Logistics & services | 4 h | USD 9,000 | 2 | 26.7% |
| Lost circulation | 4 h | USD 9,000 | 1 | 53.3% |
| Equipment failure | 3 h | USD 6,750 | 2 | 73.3% |
| Stuck pipe | 2 h | USD 4,500 | 1 | 86.7% |
| Wellbore instability | 2 h | USD 4,500 | 1 | 100% |
The first three categories account for 11 of 15 hours, or approximately 73.3%. This is a useful concentration signal. It is not a reason to force an “80/20” story onto the dataset. The equal four-hour categories have the same contribution even though the chart places one first. Their order does not establish greater risk or avoidability.
Read duration and frequency together. Two service records suggest a question about repeated mobilisation or coordination, while the single four-hour losses record suggests a question about one extended interruption. Two equipment records across two wells justify checking whether the reported interruptions share equipment identity or maintenance context. The category labels alone do not establish that they are the same failure mode.
A useful first review meeting would therefore examine the service records and the equipment overlap together, then investigate the prolonged losses entry with its technical records. This is a proposed investigation sequence derived from the synthetic evidence. It is not a field instruction to alter mud properties, pressure limits, equipment operation or well-control procedures.
The persuasive value of DrillAstra is this progression: the Pareto helps you choose where to look, the event ledger helps you find the right records, and evidence-linked review helps you decide what can be concluded. A chart becomes an entry point into an investigation instead of the final answer.
9. Compare wells without losing the operational context
Open Offset-Well Intelligence and select ASTRA-DEMO-A and ASTRA-DEMO-B. We excluded an older acceptance-test well from the view so the article comparison contained only its own two-well dataset. The DrillAstra comparison uses effective hours after overlap resolution and retains the campaign’s denominator and economic basis.
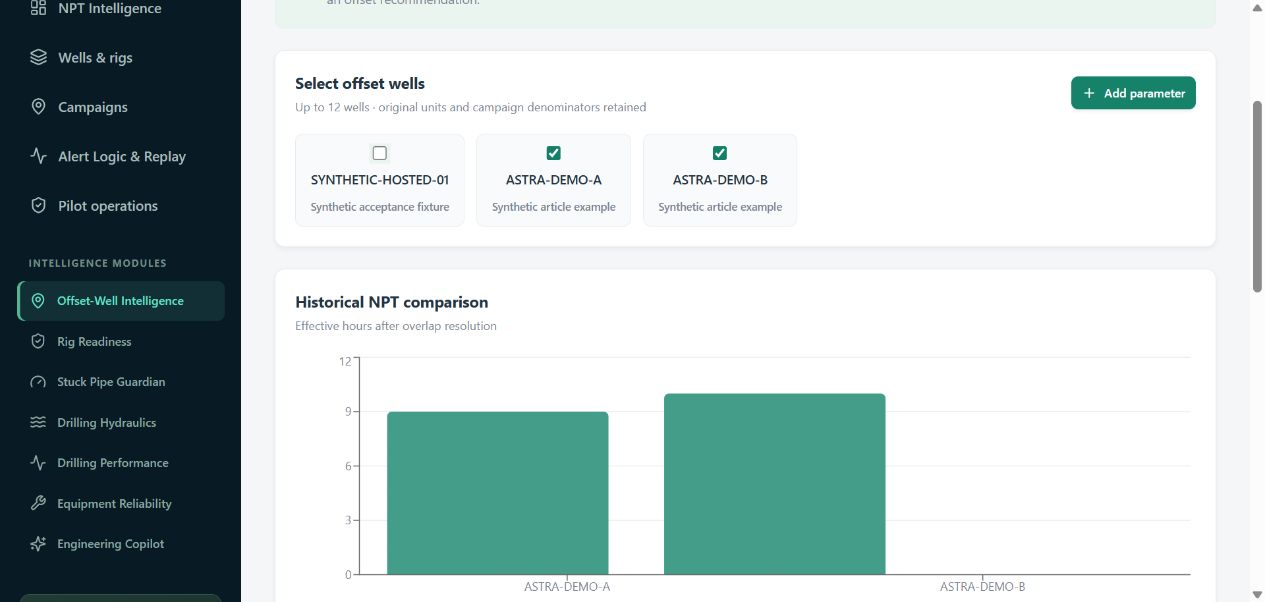
Well A has 48 logged hours, ten NPT hours, a displayed NPT share of 20.83% and USD 22,500 of estimated exposure. Well B has 48 logged hours, five NPT hours, a displayed share of 10.42% and USD 11,250 of estimated exposure. Both use the same illustrative rate and denominator policy, which makes the arithmetic comparison straightforward.
It would still be wrong to announce that B demonstrates a proven 50% operational improvement. The synthetic files were deliberately constructed with different interruptions. They supply no verified equivalence in geology, trajectory, hole section, equipment condition, service availability or technical difficulty. The numbers demonstrate comparison functionality, not a controlled field experiment.
For your real offset study, narrow the question before ranking wells. Are you comparing the same hole section? Similar formation exposure? The same rig or equipment configuration? Similar mud systems and reporting coverage? An offset recommendation becomes more credible when the evidence explains where the analogy holds and where it breaks down.
DrillAstra’s lessons and risk register provides a place to record observations for review. Sourced drilling parameters retain their original values and units. In this demonstration no measured parameters were supplied, so DrillAstra showed an empty parameter table rather than invented readings. That absence is useful: it tells the reviewer exactly which context still needs to be added.
A sensible lesson from the example would be phrased as an investigation lead: “Review backup-pump mobilisation arrangements before the next comparable operation, with supporting service records.” A less defensible statement would prescribe a new pump configuration solely because the category appeared in a chart. DrillAstra supports documenting the former and keeping its applicability open to review.
10. Drill into an NPT event and review the classification
Open the equipment interruption on ASTRA-DEMO-A. Its detail page ties together the original narrative, start and end timestamps, reported duration, effective duration, estimated exposure, classification method and review status. This is where a high-level dashboard signal becomes a record someone can inspect and challenge.
The source narrative says that a pump failure was reported and pumping was interrupted pending component inspection, with the mechanism unverified. That supports investigating an equipment interruption. It does not establish a failed bearing, valve, seal, drive component or maintenance practice. The DrillAstra detail page retains the difference between the reported event and a proposed explanation.
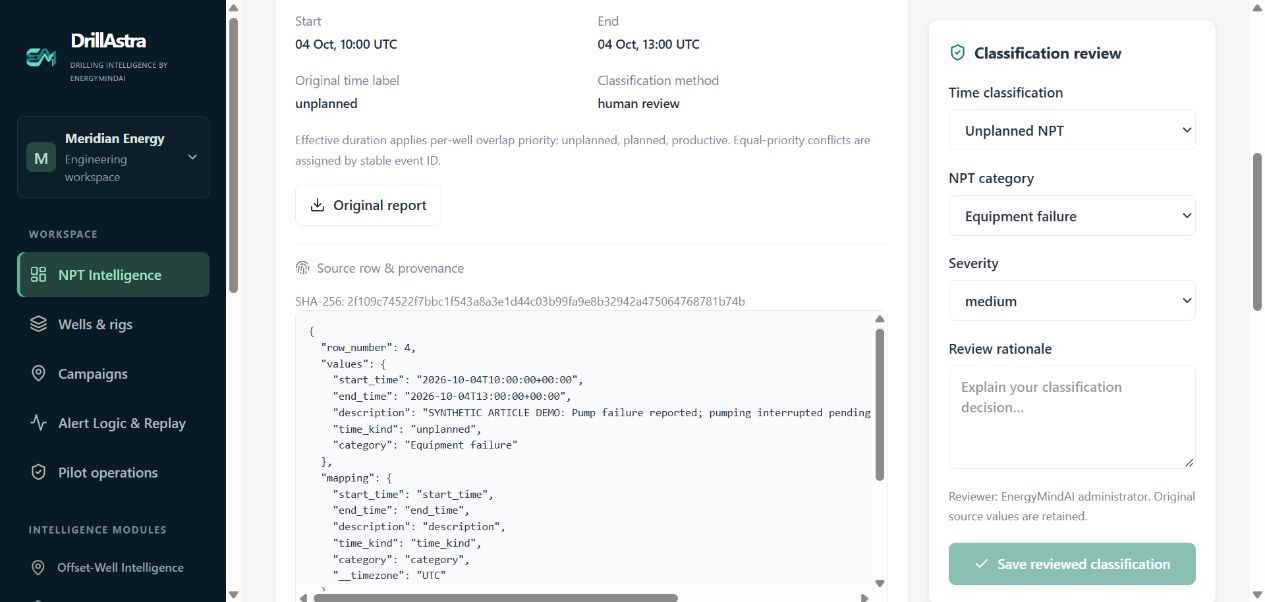
For the demonstration review, we retained unplanned NPT and Equipment failure, then saved a rationale explaining why the narrative supported that classification. The rationale also recorded the three reported hours, two effective hours after overlap allocation and the unresolved mechanism. The page then showed Classification reviewed and a human-review classification method.
Notice what did not happen: the confidence field did not become a percentage just because a human clicked save. DrillAstra continued to show Not calibrated. A reviewer can approve a classification within a policy without producing a statistically calibrated probability. A polished interface should not manufacture a number to make a judgement appear more scientific.
Use the review rationale to answer three practical questions: what evidence supports the chosen label, what remains uncertain, and what follow-up is needed? If the source category is wrong, change it with a reason. If timestamps are disputed, reconcile them through the appropriate import or data-correction process. Keep the original evidence available so later reviewers can understand what changed.
The source fingerprint is also worth understanding correctly. A SHA-256 value identifies the file content used for the record. It helps distinguish versions and locate the same source. It does not prove that the report writer observed the event accurately, that a supplier accepted the classification or that the source is complete. Provenance supports investigation; it is not a substitute for it.
11. Generate an advisory and keep root-cause review human
From the event page, generate an advisory in the root-cause workspace. The demonstration runs without an external AI API key and uses a rule-based advisory provider. It links the proposed investigation to the source operation and explicitly says that a specific causal mechanism cannot be established from the description alone.
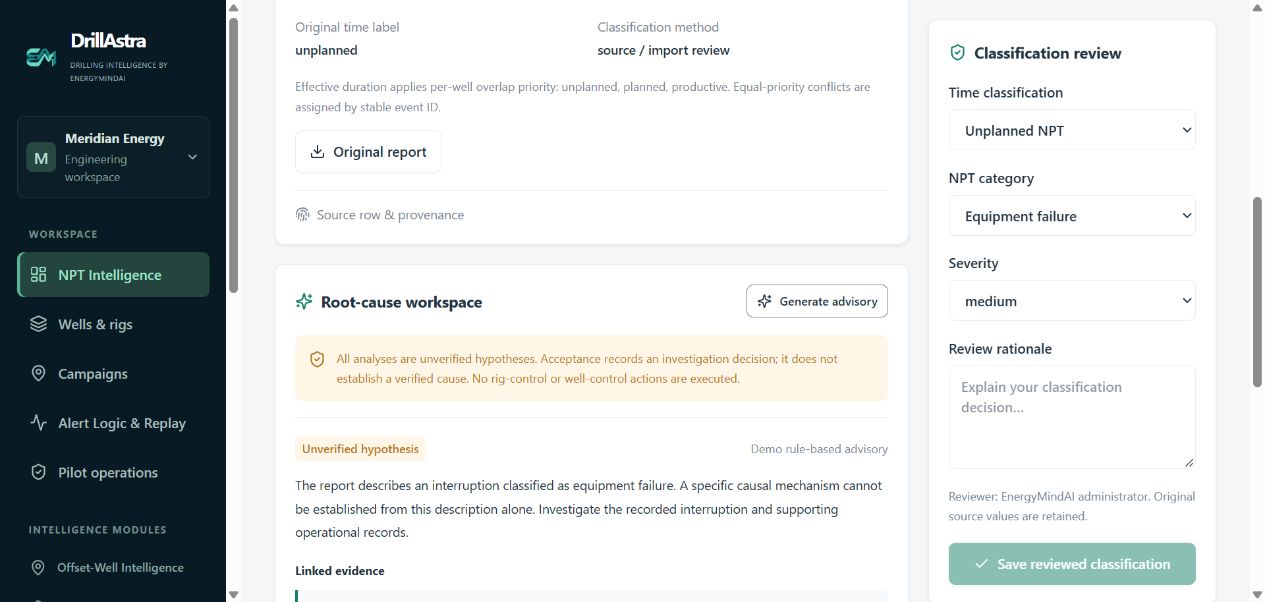
The generated investigation suggestions were to inspect the maintenance history and failure records, then compare inspection findings with operating logs before assigning a mechanism. We accepted the advisory for investigation, with a note requesting maintenance history, component inspection findings, a return-to-service record and the backup-pump mobilisation timeline.
This wording matters. “Accepted for investigation” tells the next person that the lead is worth pursuing. It does not announce that the investigation is complete. In the example, no component inspection result was supplied, so no component failure mechanism became verified. DrillAstra preserved the proposed advisory, linked evidence and subsequent review history.
A strong engineering review can also reject an advisory. Perhaps it generalises beyond the source, relies on the wrong well or overlooks a known planned activity. Record why it is unsuitable and identify the missing evidence. The value of an AI-assisted workflow depends on the quality of this review, not on accepting every generated suggestion.
DrillAstra provides an AI provider abstraction for optional LLM integration. An external LLM was not configured or used for this article. Any future provider should still be treated as an advisory assistant: source-grounded proposals, visible limitations and human review remain essential. No advisory in this workflow authorises an automated rig-control or well-control action.
For an actual root-cause investigation, combine the DDR with maintenance work orders, inspection photographs, component identification, operating history, service tickets and the people who managed the interruption. DrillAstra can organise the evidence trail and follow-up, while the engineering process establishes whether a cause is supported.
12. Use Engineering Copilot for a detailed evidence-led analysis
Engineering Copilot is most useful when you ask a question that can be checked against a defined set of documents. In the demonstration we uploaded the actual exported campaign report and an author-prepared synthetic investigation brief. Both were explicitly marked as demonstration content. The brief explained the calculation and missing evidence; it was not an independent technical report validating the results.
The Copilot screen lets you choose all workspace documents or a well with shared documents. Select a scope that matches the question. A well-specific question should not silently inherit an unrelated well’s narrative. Upload the relevant source files, mark synthetic content where appropriate and index them. Text PDFs retain page locators; CSV and XLSX content can retain row references.
Our first question was: “What evidence is needed to investigate pump failure and backup-pump mobilisation in the synthetic DrillAstra demo?” The local evidence search returned five source excerpts, including the explanation in the synthetic brief, the original exported mobilisation row, the other well’s equipment row, a header match and the original exported pump row.
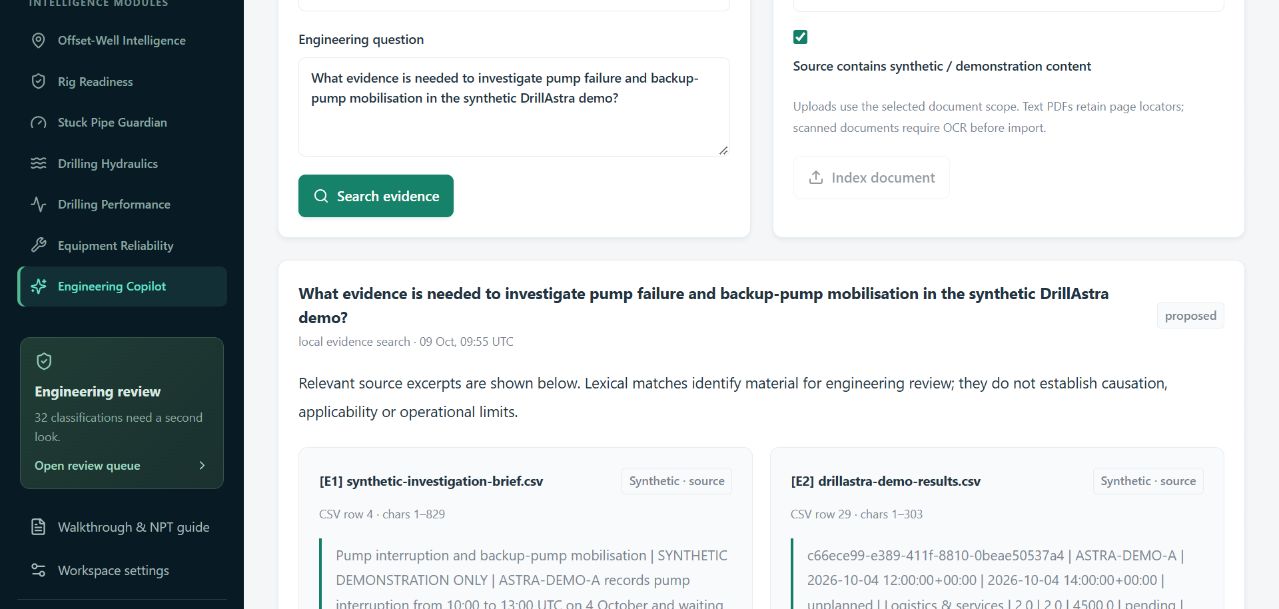
The result illustrates both the value and the limits of the default provider. It returned evidence quickly, including the two records needed to understand the overlap. It also returned a header and a record from well B, which must be assessed for relevance. The displayed response explained that lexical matches do not establish causation, applicability or operational limits.
This default mode is local evidence retrieval, not an autonomous diagnostic essay. It does not calculate a new engineering conclusion simply because a question mentions cost or failure. The analysis below is a human interpretation of the verified export and retrieved evidence. Optional LLM integration can support a different advisory response style, but it was not demonstrated here.
Question A: what actually happened during the pump interruption?
Start with the original pump and mobilisation rows, rather than the author-prepared summary. Confirm the well, date, timestamps and descriptions. The pump record spans 10:00–13:00 and the service record spans 12:00–14:00. Their combined elapsed interval is four hours. The export preserves three reported pump hours but assigns two effective hours to that row.
The resulting observation is precise: the synthetic report records a pump interruption and backup mobilisation with an overlapping interval. The uncertainty is equally precise: no inspection evidence establishes the pump mechanism, and the narratives do not decide who was responsible for the shared hour. The investigation should request the maintenance, inspection, restoration and mobilisation records necessary to resolve those questions.
Useful follow-up questions for Copilot include “Which uploaded record describes when the pump returned to service?” and “What inspection evidence identifies the component involved?” If those records have not been uploaded, a relevant excerpt cannot be conjured into existence. A missing search result indicates an evidence gap in the indexed material, not proof that the equipment was fault-free.
Question B: which patterns account for most of the campaign exposure?
Use the campaign report and category table to establish the distribution: services four hours, losses four, equipment three, stuck pipe two and instability two. Under the common hourly rate, services and losses each correspond to USD 9,000 of estimated exposure. The first three categories together represent 11 hours and USD 24,750.
Then ask a more discriminating question: “Which records show repeated service waiting, and what source evidence explains the delay?” Two service records support looking for recurring coordination problems, but their existence does not prove a shared organisational cause. Compare request times, promised arrival, actual arrival, readiness checks and activity sequencing if those sources become available.
The losses record deserves a different investigation. It accounts for four hours in one entry, but the example supplies no measured pressure trace, loss rate, depth or formation evidence. Copilot should help locate those records if uploaded. It should not turn the category into an unsupported mud-programme prescription or infer a well-control condition from the label alone.
Question C: what can we reuse before the next comparable well?
Ask for evidence supporting a specific lesson, not a generic list of drilling tips. “Which reviewed records support checking backup-pump availability and mobilisation arrangements?” is more useful than “How do we avoid every future failure?” Review the applicability to the next rig, well section and service arrangement before recording the lesson.
A reasonable proposed action in this example is to assemble the pump evidence and check the service timeline. A proposed readiness item could ask for current maintenance status and documented backup arrangements. Neither action should be marked effective merely because it was created. Closure needs evidence, and an improvement claim needs a later comparable measurement.
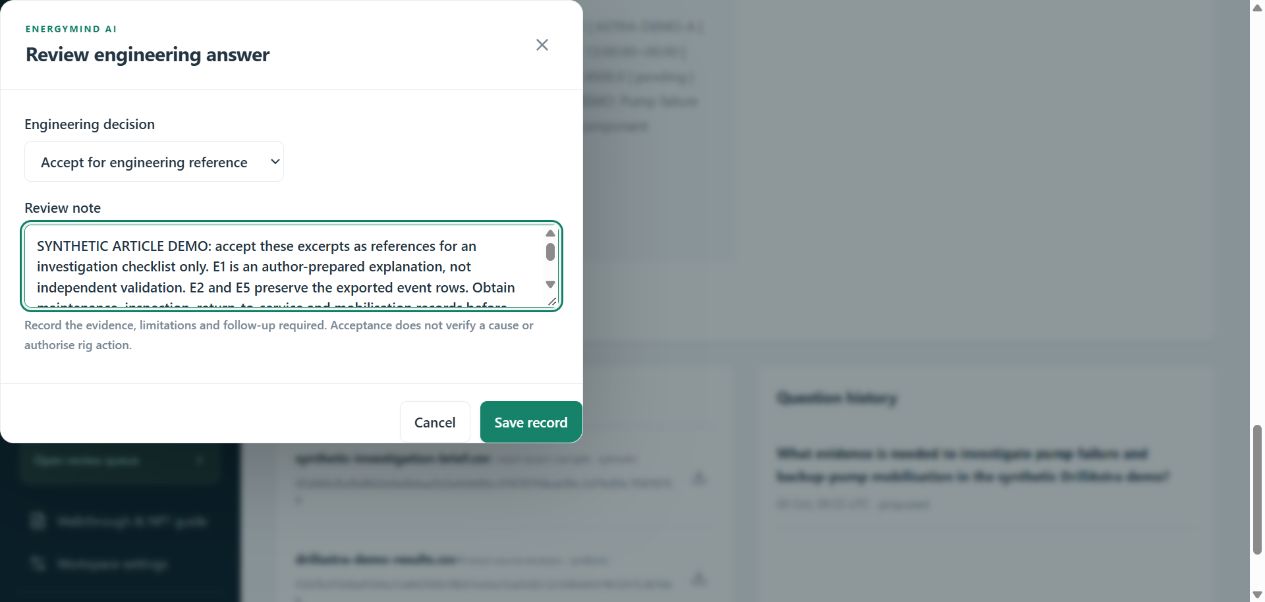
We accepted the retrieved material for engineering reference with a note saying that the brief was an explanation, not independent validation, and that original exported rows supported the event description. The note requested additional records before assigning a mechanism and approved no operational instruction. This creates a useful record of what the reviewer actually accepted.
A repeatable Copilot method has five parts: choose the scope, ask one evidence question, inspect the excerpts, distinguish original evidence from summaries, and record the conclusion with its limits. When a question is too broad, divide it into event, mechanism, cost and applicability questions. This produces a more useful engineering conversation than an impressive paragraph that nobody can trace.
13. Turn findings into follow-up actions and readiness questions
An NPT report creates value when the review continues beyond the chart. In the live DrillAstra demonstration, accepting the equipment advisory for investigation produced two open actions for ASTRA-DEMO-A: inspect maintenance history and failure records, and compare inspection findings with operating logs before assigning a mechanism. They appear in the Rig Readiness engineering action queue.

Review these actions with the people responsible for the evidence. Make the request specific enough to complete: identify the equipment record, the inspection report, the operating interval and the service ticket required. Avoid vague tasks such as “improve reliability,” which are difficult to close and impossible to evaluate consistently.
The readiness workspace covers equipment, crew, materials, certification and services. Its stated workflow treats critical blockers and evidence validity as review conditions, and editing a checklist resets its approval. The screenshot here demonstrates the action queue; it does not show an approved readiness assessment or certify that a real rig is ready to drill.
The example suggests useful readiness questions: is the pump’s maintenance status supported by records, has the backup arrangement been checked, and does the service mobilisation plan fit the intended operation? These questions follow from the synthetic interruption. Actual acceptance criteria must come from your approved equipment, operational and assurance requirements.
Equipment Reliability can extend the investigation with sourced equipment identity, maintenance and failure records when supplied. Drilling Hydraulics and Drilling Performance require their own engineering inputs. The synthetic DDR dataset contains no measured ECD, torque, drag, ROP or MSE history, so those results are not presented as discoveries from this example.
Keep the improvement loop explicit: identify the event, inspect evidence, review the hypothesis, assign the investigation, implement an approved response through your organisation’s process, then evaluate a comparable later period. DrillAstra helps organise the first steps and the records that support the loop. A completed action is still different from a demonstrated reduction in future NPT.
14. Explore logical alerts with synthetic sensor replay
Many teams ask whether drilling intelligence should focus on post-well reports or real-time rig-floor alerts. The two workflows answer different questions and need different acceptance standards. Historical NPT analysis reconciles what was reported. Sensor rule evaluation examines time-ordered measurements and conditions. A category in a DDR should not automatically become a live alarm.
DrillAstra exposes this distinction in Alert Logic & Replay. The workspace provides reviewed DDR intelligence, historical sensor-log replay and a read-only advisory receiver path that requires field commissioning. The public demonstration does not claim a commissioned physical rig feed, continuous rig-floor delivery or an operational safety system.
We ran the built-in synthetic replay. The saved result contained 61 source samples, four rule episodes awaiting review, one bad-quality sample and zero data gaps above 15 seconds. Three episodes showed a persisted clear condition. A later torque episode was interrupted by invalid quality, a missing channel or an operating-state exit, as reported in the replay lifecycle.
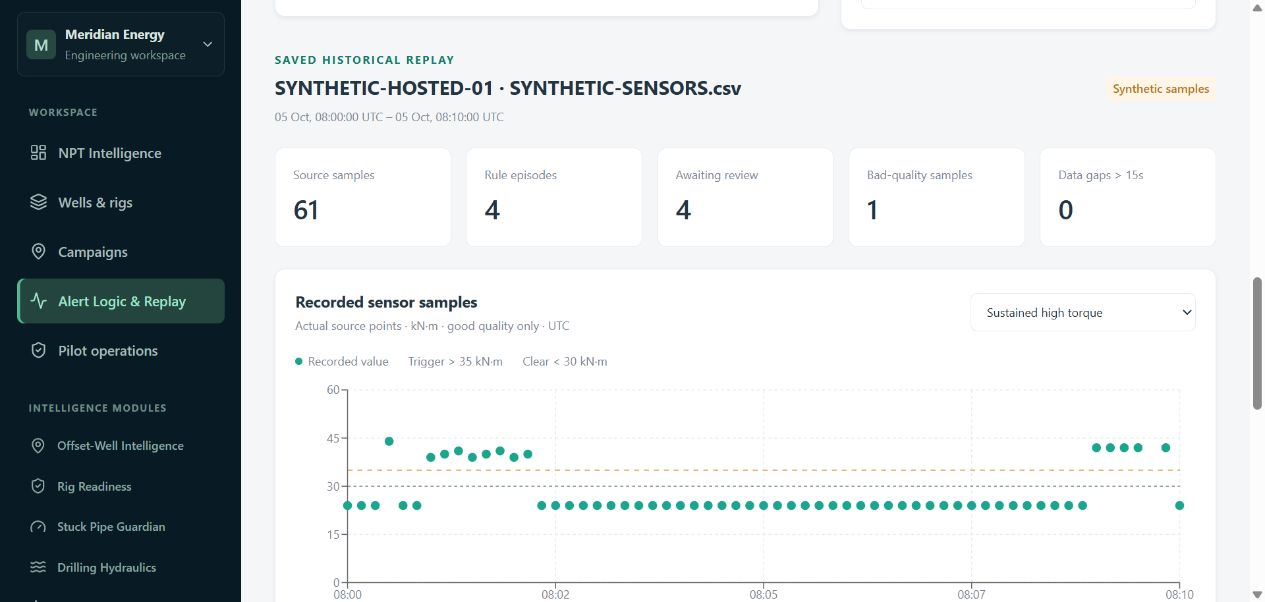
The configurable rule logic includes trigger and clear thresholds, trigger and clear persistence, maximum sample gap, cooldown and operating-state selection. These controls matter because a transient spike, sustained excursion, invalid sample and state transition should not all receive the same interpretation.
Persistence asks whether a condition lasts long enough to qualify under the selected rule. Separate clear thresholds and persistence help control repeated toggling around a boundary. Quality and state gates determine which samples are eligible. A gap policy prevents missing data from silently masquerading as continuous evidence. Cooldown controls repeated episode handling after a transition.
The displayed thresholds are illustrative, unvalidated demo values. The synthetic replay showed peaks of 41 kN·m for one torque episode, 280 bar for pressure, 430 kN for hookload and 42 kN·m for a later torque episode. These are generated fixture values, not operating limits or readings from a real rig. They should never be copied into an operational rule solely because they appear in this article.
A rule match means the specified logical condition was met by the supplied samples. It does not establish stuck pipe, a well-control condition, a failure mechanism or a calibrated confidence score. The replay is historical and read-only. No automatic rig-control or well-control action is executed, and no live notification is demonstrated here.
For a future site pilot, define the sensor source, units, timestamps, expected sampling, rig states, quality flags and responsibility for review. Validate thresholds against known history, assess false positives and missed events, and test the delivery and availability requirements separately. This article demonstrates the review logic; operational commissioning remains a separate engineering task.
15. Export the report and run a repeatable NPT review cycle
Use Export report in NPT Intelligence to download the CSV summary and event log or the printable HTML summary. The campaign filter matters: export the synthetic article campaign rather than the whole workspace if you want to reproduce the numbers here. The CSV is especially useful for reconciling exact values behind compact dashboard cards.
We downloaded the report and checked it against the source arithmetic. It contained 19 event rows and the campaign totals of 96 logged hours, 15 effective NPT hours, a displayed 15.62% share and USD 33,750 of exposure. It also retained the one-hour overlap measure, original file names, descriptions, reported durations, effective durations and review status at the export checkpoint.
Download the synthetic DrillAstra demonstration files to inspect the two source CSVs, the exported results and the investigation brief used in this article. The package contains training data and explanatory material only. It contains no application source code, credentials or client records. The exported report captures the initial import checkpoint; the pump and Copilot reviews shown later occurred afterwards.
Build the review meeting around decisions that can be supported. Start by agreeing coverage and assumptions. Reconcile the total. Examine the largest categories and the longest individual interruptions. Inspect overlaps and classification exceptions. Compare wells with the necessary context. Use Copilot to find the documents needed to test a hypothesis. Finish with specific follow-up and a clear statement of what remains unverified.
For the synthetic campaign, that sequence produces three useful investigation themes. First, equipment and services need a shared timeline because one interval overlaps. Second, a single four-hour losses entry deserves technical evidence before its mechanism is discussed. Third, the two-well contrast prompts a contextual comparison, not an unsupported announcement that one method is superior.
For a real campaign, repeat the same method at an agreed cadence. Keep the reporting policy stable long enough to compare results. If the policy or economic inputs change, record the change and explain its effect. A falling percentage with a larger denominator can mean something different from fewer interruption hours. A lower exposure figure can result from a lower assumed rate rather than better operations.
A strong report has an evidence statement, an observation, a proposed explanation and a next step. For example: “The service category contributes four effective hours in this synthetic export. Two records are involved, one overlapping equipment restoration. Review mobilisation tickets and the agreed overlap allocation before assigning a shared cause.” That statement is more actionable than “Logistics is our biggest problem.”
A practical playbook for analysing NPT patterns and challenges
Check completeness before interpreting absence. A blank period in the ledger does not prove perfect performance. Confirm reporting coverage, expected shifts and whether the import contains the whole operation. A narrow sample can support a local observation without representing the campaign’s overall behaviour.
Separate recurrence from one long incident. The example’s four-hour service contribution comes from two records, while the losses contribution comes from one. Those patterns may need different evidence requests. For recurrence, inspect common equipment, service arrangements and operating context. For a prolonged incident, reconstruct the sequence and decision points.
Compare rate and severity carefully. Event counts can be distorted by reporting granularity: one supervisor writes a continuous interruption as one record, another writes separate shift entries. Counts are records until you reconcile whether they describe independent episodes. Effective hours are more suitable for the time ledger, but even they depend on timestamps and classification quality.
Look for sequencing and dependency. The pump example asks whether restoration and backup mobilisation ran in parallel, or whether one process actually delayed the other. A service timeline and return-to-service record can clarify that relationship. Category totals alone cannot establish a dependency chain.
Normalise before drawing a trend conclusion. Compare the same denominator, reporting coverage and relevant operational context. Where possible, compare like sections and similar exposure to the activity being studied. Document the differences that cannot be reconciled. A transparent limited comparison is more useful than a precise-looking ranking that ignores the reason the wells differ.
Test the proposed mechanism. If someone suggests a maintenance cause, ask which inspection or history record supports it. If someone suggests a formation-related cause, ask for the relevant depth, geological and operational evidence. Use Copilot to locate the material, then have a qualified reviewer assess it. DrillAstra’s citation is a route to the source, not a stamp of technical truth.
Prioritise investigation with both impact and tractability. A large category may be worth examining first, but severity, recurrence, evidence availability and the consequence of a wrong conclusion also matter. The Pareto provides the time distribution. The engineering team provides the wider risk and decision context.
Measure improvement prospectively. Establish the baseline and what will count as a comparable follow-up. Record approved changes and their implementation evidence. Review later performance on the same basis, with enough context to avoid attributing every favourable result to the change. DrillAstra can help organise the record; the demonstration makes no achieved-savings claim.
DrillAstra questions engineers and managers often ask
Can I try DrillAstra without supplying client drilling records?
Yes. Request a free guided demo from EnergyMindAI using synthetic data. The walkthrough demonstrates the core workflow without exposing client reports or inventing field measurements. If you later want to assess your own records, agree the permitted data, access and handling requirements with the team before sharing them.
Does every period without drilling count as NPT?
No. DrillAstra distinguishes productive time, planned non-drilling time and unplanned NPT. Your organisation’s approved reporting policy determines how the activities should be classified. Planned work should not be relabelled as an unexpected interruption merely to simplify a chart.
Why is the NPT percentage different from another report?
Check the denominator, classification policy, overlap treatment, timezone and reporting coverage. In this example, 15 NPT hours over 96 logged hours displays as 15.62%. Removing ten planned hours from the denominator would give approximately 17.44% without changing the NPT hours. Comparing percentages without these assumptions can mislead.
Does the USD 33,750 result mean DrillAstra saved that amount?
No. It is estimated exposure from synthetic NPT hours and illustrative rates. The one-hour overlap adjustment avoids overstating that example by USD 2,250. Neither figure demonstrates recovered rig time or achieved savings. Real economic evaluation needs your approved inputs and subsequent operational evidence.
Does Engineering Copilot work without an LLM API key?
Yes. The demonstrated default mode uses local evidence search and returns exact excerpts for review. The event advisory demonstrated here is rule-based. Optional LLM integration exists through the provider abstraction, but an external LLM was not configured for this article. Human review remains part of both workflows.
Can Copilot verify a root cause automatically?
The demonstration does not do that. It retrieves supporting material and helps structure an investigation. Accepting an advisory for investigation or an answer for engineering reference records a review decision. It does not establish a physical mechanism, prove applicability or authorise an operational action.
What happens when confidence is unavailable?
The event page shows “Not calibrated” rather than inventing a percentage. A human review does not create a numerical probability. Use the source narrative, review rationale and evidence gaps to understand the basis of the classification.
Can I use a scanned DDR PDF?
A scanned document may need OCR before import or indexing. Inspect the extracted text and operational rows against the source, especially timestamps and table columns. Structured text PDFs, CSV and XLSX are supported paths, but file format alone does not guarantee correct interpretation.
Is the sensor replay a live rig-floor alarm service?
No live rig-floor delivery is demonstrated in this guide. Historical replay is available, and DrillAstra includes a read-only advisory receiver path that needs field commissioning. Site-specific thresholds, data quality, delivery, acceptance and availability must be validated separately. The synthetic rules are not operating limits.
Does DrillAstra send automatic rig or well-control commands?
No. The demonstrated workflows are analytical and advisory. They support engineering review and preserve source evidence. Operational and well-control decisions remain with the authorised people and approved procedures.
Is demo access available immediately to everyone?
Contact EnergyMindAI to arrange access. The hosted free beta can pause when idle, so initial loading may take time. A guided demo is intended for evaluation; continuous operational availability and enterprise service requirements need a separately agreed deployment and commissioning plan.
Can viewers download DrillAstra source?
DrillAstra repository is private. The public product page and article explain DrillAstra, and the downloadable package contains synthetic demonstration files only. As with any web application, browser-delivered interface assets can be inspected; that is different from publishing the private application repository, backend code or credentials.
Request a free DrillAstra demo with EnergyMindAI
If your team has ever disputed an NPT total, searched through reports for a missing explanation or struggled to carry lessons from one well into the next, DrillAstra offers a practical place to start. Bring the questions you want answered: overlap reconciliation, classification consistency, cost assumptions, repeated service delays, equipment evidence or offset applicability.
A useful first demo does not need a grand transformation programme. Start with a representative report and an agreed question. Walk through the import, validate the accounting, examine a category, open an event, search the evidence and record a follow-up. That short cycle shows how DrillAstra fits the work your engineering team already needs to do.
For the free guided session, EnergyMindAI can use synthetic material like the example in this article. Explain your role and the workflow you want to assess. If a later evaluation involves company documents, agree the permitted scope and handling before supplying them. You do not need to send confidential files just to request the demonstration.
Explore the product: DrillAstra — Drilling Intelligence by EnergyMindAI. Request your free demo: partnerships@energymindai.com. Continue the walkthrough: the interactive DrillAstra walkthrough and NPT guide.
DrillAstra gives drilling teams a way to connect a downtime number to its source, a source to an investigation, and an investigation to reviewed follow-up. The demonstration shows that workflow with transparent assumptions and visible uncertainty. A free guided demo is the next step toward evaluating it against the questions that matter in your own operations.
