

By Saad Iqbal
It’s two in the morning on a gas gathering system in a basin that wasn’t built for this kind of cold snap. Ambient temperature falls off a cliff, a compressor trips, and a flowline that normally sits a comfortable margin above its hydrate point starts sliding, quietly, toward it. Nobody is watching that pressure-temperature trend in real time — the duty engineer is asleep, the SCADA screen is one of forty, and the first sign of trouble is a slow pressure climb hours later that looks, at first glance, like nothing at all. By the time anyone connects the dots, an ice-like hydrate solid has already started growing inside the pipe, and what should have been a five-minute methanol shot has become a multi-day, six-figure deferred-production event — assuming nobody gets hurt depressurizing a line with a plug still trapped inside it.
That scenario is not hypothetical, and it is not rare. It’s the reason gas hydrate management exists as its own discipline inside flow assurance, and exactly the kind of slow-building, easy-to-miss risk that machine learning is now good at watching so a human doesn’t have to catch it by luck. Being able to predict gas hydrate formation risk before a line crosses into the danger zone, rather than reacting once a plug is forming, is what’s starting to change how upstream gas and condensate operators run gathering systems through a cold snap, a compressor trip, or any unplanned shut-in.
What Is a Gas Hydrate, and Why Does It Form in Flowlines?
A gas hydrate is not frozen water. It’s a crystalline solid — an ice-like clathrate — in which water molecules lock into a cage-like lattice around a trapped molecule of light hydrocarbon gas: methane, ethane, propane, and similar small molecules. Enough of these cages together and you get a solid that behaves a lot like packed slush, except it forms at temperatures well above the freezing point of water, because it’s the combination of pressure and temperature, not temperature alone, that drives the chemistry.
Three things have to be present at once for a hydrate to form:
- Light hydrocarbon gas — methane and its lighter relatives are the classic hydrate formers.
- Free water — condensed or produced water in contact with the gas phase; without it, there is nothing to build the lattice.
- The right pressure-temperature combination — high enough pressure and low enough temperature to sit inside the hydrate-formation envelope for that gas composition.
This is a genuinely different animal from wax, or paraffin, deposition, even though both end in an operator’s nightmare: a plugged flowline. Wax formation is a purely thermal solubility problem — heavy hydrocarbon chains fall out of solution as fluid cools below its cloud point, the same way fat congeals in a cooling pan of bacon grease. Pressure barely enters into it. Hydrates, by contrast, are a pressure-temperature phenomenon: squeeze the gas harder and, counterintuitively, you raise the temperature at which hydrates can form, which is exactly why deepwater and high-pressure gas systems are so exposed. We’ve covered the wax side of this in detail in AI Wax Deposition Prediction: Stop Flowline Blockages — worth reading alongside this one, since the two mechanisms get lumped together in casual conversation but call for genuinely different monitoring logic.
How Engineers Have Estimated Hydrate Formation Temperature — Until Now
None of this is new science. Flow assurance engineers have had good hand tools for hydrate prediction for the better part of a century, and they’re worth naming because AI doesn’t replace them — it makes them faster to apply and easier to watch continuously.
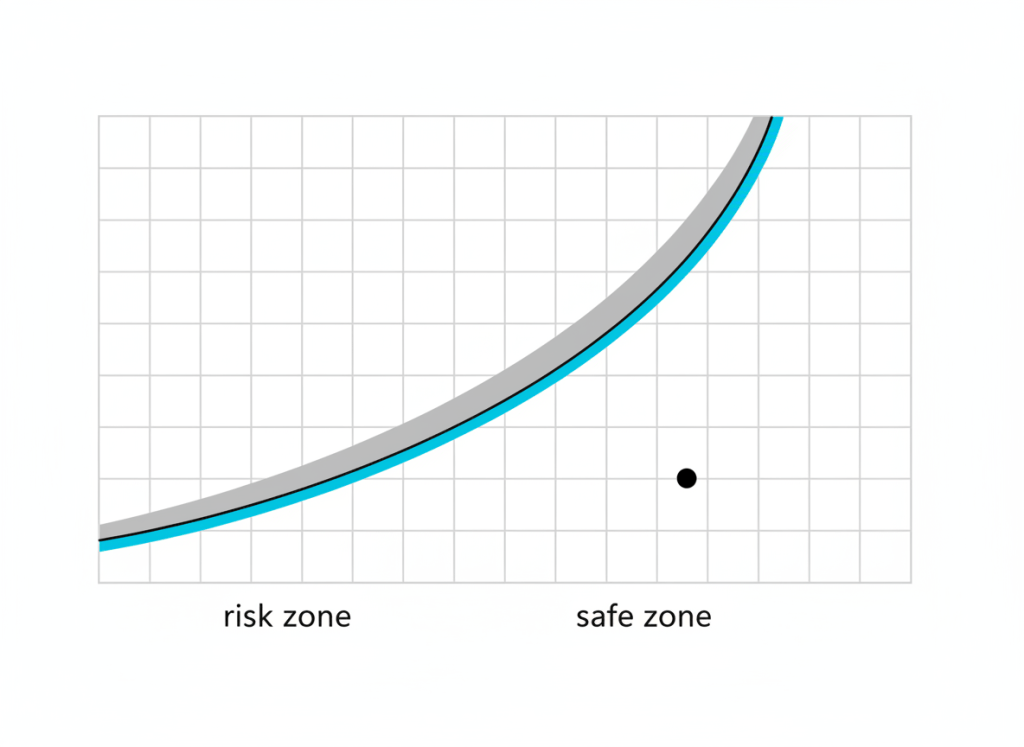
The first is the gas-gravity chart method, popularized by Katz in the 1940s: a graphical correlation that lets an engineer estimate the hydrate formation temperature for a gas of a given specific gravity at a given operating pressure, read straight off a published chart. It’s a coarse tool — it doesn’t capture the fine detail of gas composition the way a full thermodynamic flash does — but it has stayed in service for decades because it’s fast, and its direction is reliably correct: raise the pressure on a given gas, and the hydrate formation temperature goes up, shrinking the safe operating window.
The second is the Hammerschmidt equation, the workhorse for estimating how much a thermodynamic inhibitor — methanol or mono-ethylene glycol (MEG) — depresses that hydrate formation temperature once injected into the water phase. In simplified form, the temperature depression scales with the weight percent of inhibitor in the free water and inversely with the inhibitor’s molecular weight. As a purely illustrative example: dosing methanol (molecular weight roughly 32) to about 10 weight percent of the free water phase, using Hammerschmidt’s constant of 2335, works out to a depression on the order of 8°F — enough, in many cases, to pull an operating point back out of the hydrate envelope. Real dosing calculations are more careful, and only as good as the water-cut estimate feeding them, but the relationship holds: more inhibitor, lower hydrate formation temperature, wider safety margin.
What both methods have in common is that they’re static. An engineer runs the calculation for a design case, picks a subcooling margin — often a flat, conservative number like 5°F or 10°F below the calculated hydrate point — and that margin gets applied uniformly, regardless of how conditions on a specific line are actually trending that day.
How Does AI Change Hydrate Risk Monitoring in Real Time?
This is the actual shift, and it’s less about a new equation and more about turning a once-a-quarter calculation into a live signal. A machine learning pipeline built for this problem continuously ingests SCADA pressure, temperature, and flow trends for every flowline, plots each one’s current operating point against its own hydrate-formation envelope, and folds in the two variables that make a static subcooling margin misleading: produced water cut, which drives whether there’s enough free water present for hydrates to nucleate, and a short-range ambient-temperature forecast, which tells the model whether a line that looks fine now is about to get colder outside.
The output engineers actually look at is a live “hydrate risk margin” per line — not a pass/fail alarm, but a continuously updated number showing how much subcooling buffer is left before that specific line, under its current water cut and forecast conditions, crosses into the envelope. That reframes the whole workflow. Instead of a blanket inhibitor dosing rate applied across a field because it’s safe for the worst-case line, engineers can see which two or three lines are actually approaching risk on a given night and increase methanol or MEG injection on exactly those lines, proactively, before the crossing happens — and hold dosing lower on lines with healthy margin, cutting chemical spend without adding risk.
The Tools Behind This Workflow
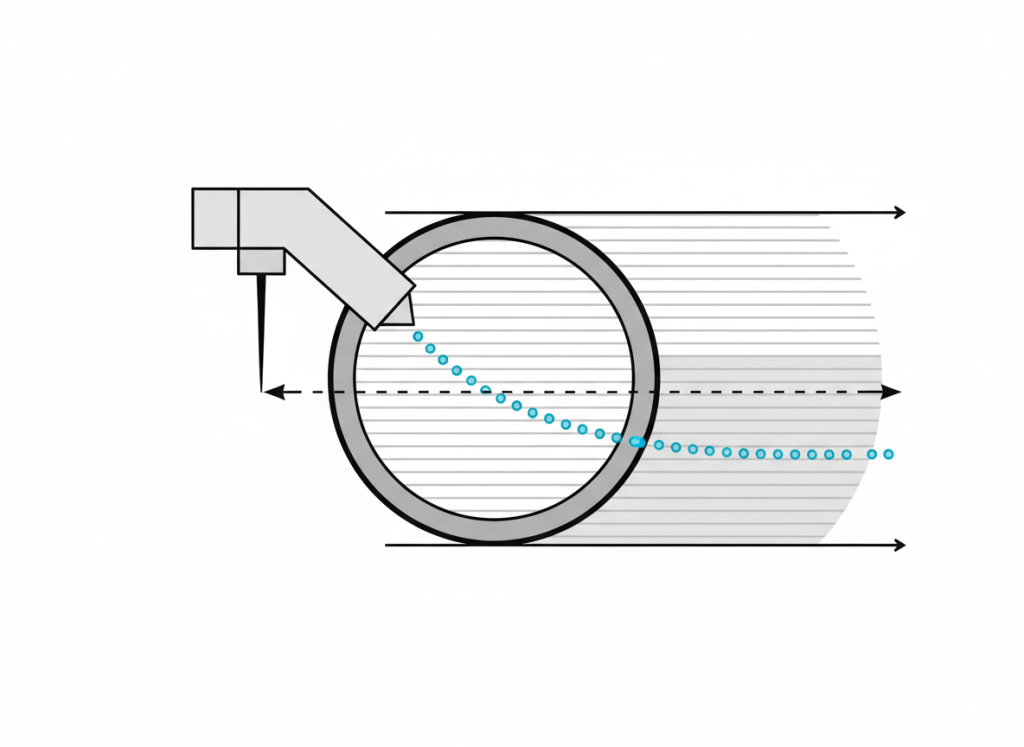
None of this requires exotic technology, and it’s worth naming what’s actually running under the hood, since “AI” in flow assurance is mostly disciplined data engineering with a forecasting model on top.
- Python and pandas are the default combination for pulling historian tags out of SCADA, cleaning them, and structuring pressure, temperature, flow, and water-cut series for a model — the unglamorous plumbing that makes everything downstream possible.
- The open-source Python petroleum-engineering tooling ecosystem is growing fast; libraries like petropt now package PVT correlations, Z-factor and decline-curve calculations that used to live only in spreadsheets, lowering the barrier to building an in-house analysis layer.
- For getting the hydrate risk margin in front of a control-room engineer, dashboarding tools like Microsoft Power BI or Google Looker Studio turn a model’s output into a live, field-by-field view instead of a spreadsheet nobody opens.
- On the phase-behavior side, purpose-built flow assurance software already does rigorous hydrate thermodynamics — Calsep’s PVTsim Nova includes a dedicated hydrate module that models formation conditions for gas and oil mixtures carrying water and calculates the minimum inhibitor concentration needed at a given pressure and temperature. That kind of tool remains the design-basis authority; the AI layer watches live field data against that established physics, continuously, across every line at once.
Broader industrial AI platforms aimed at oil and gas operations — vendors like C3 AI and DataRobot, among others — are also pushing into this kind of continuous-monitoring territory as part of wider predictive-operations offerings, a sign the market treats this as a real operational need, not a one-off research exercise.

What This Changes for Inhibitor Dosing and Cold-Weather Operations
For a working engineer, the practical shift isn’t philosophical — it shows up in three concrete places:
- Dosing gets right-sized, not just conservative. Flat, worst-case inhibitor rates are expensive at field scale; a per-line risk margin lets engineers trim MEG or methanol on healthy lines and redirect budget to lines under stress.
- Cold snaps and unplanned shut-ins stop being blind spots. A shut-in flowline loses the frictional heat of flowing fluid and cools toward ambient fast — exactly the scenario a live model, fed a short-range weather forecast, is built to flag before anyone reads a trend by hand.
- Restart planning gets less risky. Knowing which lines sat closest to the hydrate envelope during a shut-in tells a team where to expect a plug before they apply heat or pressure to restart — forcing a restart into an unrecognized plug is a genuine pressure hazard.
It’s the same underlying idea behind other chemistry-dosing optimization work we’ve written about, like AI Scale Prediction Before It Chokes Your Well — the pattern across flow assurance is consistently the same: replace a flat, conservative rule of thumb with a live model of the actual physics, and dosing gets both safer and cheaper at the same time.

Does AI Replace a Proper Flow Assurance Study?
No, and it’s worth being honest about where the limits sit.
- The model is only as good as its water-cut data. Free water is a prerequisite for hydrate formation, so a system guessing at water cut is guessing at the one variable that decides whether risk is real or theoretical.
- It doesn’t replace a dedicated flow-assurance study for a new tieback. Design-basis hydrate curves for a new field, with its own gas composition and full thermodynamic modeling, still belong to specialist software and engineers — a live monitoring model watches an established envelope, it doesn’t derive one from scratch.
- Sensor and SCADA data quality is the whole game. A stalled historian tag or a miscalibrated pressure transmitter can make a line look safely subcooled when it isn’t — a live risk model is only as trustworthy as the instrumentation feeding it.
None of that makes the approach less valuable — it just means it’s a layer added on top of sound instrumentation and established thermodynamics, not a replacement for either.
Go back to that flowline at two in the morning. The physics that put it at risk — pressure, temperature, water, light gas — hasn’t changed since Hammerschmidt’s day. What’s changed is who’s watching, and how fast they notice. A duty engineer covering forty screens cannot continuously compare every line’s operating point to its hydrate envelope while also forecasting tomorrow’s cold front; a model built to do exactly that, and only that, can. Getting ahead of a plug instead of drilling one out is, in the end, the entire value proposition — and the same discipline shows up again in the gas-lift world, where slow-building instability gets caught the same way. If flowline reliability is on your radar this winter, AI Gas Lift Instability Detection: Stop Casing Heading is a natural next read.
