

By Saad Iqbal
The driller adds five thousand pounds of weight to the bit. ROP ticks up for twenty minutes, then flattens. He adds five thousand more. This time it doesn’t move at all — if anything, it’s slightly worse. Nothing on the surface panel explains why: torque looks fine, no stick-slip alarm, mud properties haven’t changed. What actually happened is invisible to a standard drilling dashboard: the bit crossed its founder point, the moment where more weight on bit stops cutting rock faster and starts just grinding energy into heat and wear. The number that would have caught it, in real time, is mechanical specific energy — and this is exactly the kind of pattern AI ROP optimization is built to catch before a driller burns three hours chasing a rate that was never coming back.
This isn’t a new idea dressed up in AI language. Mechanical specific energy (MSE) surveillance has been a documented drilling-optimization technique since the mid-2000s, when Dupriest and Koederitz’s SPE paper on real-time MSE monitoring showed operators how to spot bit inefficiency as it happened instead of after the bit trip. What’s changed is that the calculation, the founder-point detection, and the parameter recommendation can now run continuously and automatically against live rig data instead of a driller doing mental arithmetic between joints.
The Equation Underneath the Alarm
Mechanical specific energy is the amount of energy it takes to remove a unit volume of rock. Teale’s original 1965 formulation, still the version used in the field today, combines the weight-on-bit contribution with the torque contribution:

MSE = W/Ab + (120·π·N·T)/(Ab·R), where W is weight on bit in lbf, Ab is the bit’s cross-sectional area in in², N is rotary speed in rpm, T is torque at the bit in ft-lbf, and R is rate of penetration in ft/hr. The result comes out in psi — directly comparable to the confined compressive strength of the rock you’re drilling. That comparison is the whole point: when MSE climbs toward or past the rock’s compressive strength, the bit isn’t cutting efficiently anymore, no matter how the surface gauges look.
Every variable in that formula already lives on your rig’s surface data acquisition system — nothing here requires a new sensor. The only real prerequisite is bit diameter, which you already have from the BHA report, and a torque reading that’s reasonably close to bit torque rather than pure surface torque. That’s what makes MSE such a practical retrofit onto an existing drilling data stream instead of a capital project.
A Worked Example: Same Bit, Two Very Different Numbers
Take an 8.5-inch bit, so Ab = (π/4)·8.5² ≈ 56.7 in². In an over-rotary interval, the driller is running WOB = 20,000 lbf, N = 180 rpm, T = 3,800 ft-lbf, and getting R = 35 ft/hr.
MSE = 20,000 / 56.7 + (120 × π × 180 × 3,800) / (56.7 × 35)
    ≈ 353 + 129,847
    ≈ 130,200 psi
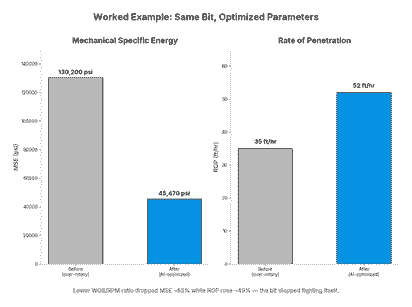
That number is far above the confined compressive strength of almost anything you’d drill through in a lateral — a clear founder signature. Now compare it to a parameter set where WOB is raised to 28,000 lbf but RPM and torque are pulled back, to 110 rpm and 3,200 ft-lbf, letting the bit dig in rather than skate:
MSE = 28,000 / 56.7 + (120 × π × 110 × 3,200) / (56.7 × 52)
    ≈ 494 + 44,976
    ≈ 45,470 psi
Same bit, same formation. MSE dropped by roughly two-thirds and ROP rose from 35 to 52 ft/hr — because the second parameter set is actually converting weight and torque into cut rock instead of fighting itself.
Why More Weight Doesn’t Always Mean Faster Drilling
Every bit-and-formation combination has a founder point: below it, adding weight on bit increases ROP roughly linearly, because the bit is cutting more rock per revolution. Past it, additional weight stops helping — the cuttings can’t clear fast enough, the bit starts regrinding its own debris, and MSE rises while ROP goes flat or drops. A driller watching only ROP and WOB on the surface panel can’t see this line coming; MSE is the number that flags it the moment it happens.

This is precisely the pattern that trips up manual optimization: the founder point isn’t a fixed WOB number painted on the drawworks. It moves with formation, bit wear, and hydraulics, so a setting that was efficient two hundred feet ago can already be past the founder point now. That’s a moving target no driller can track joint-by-joint from memory, and it’s exactly the kind of continuous pattern-matching problem AI handles well.
Where AI Actually Changes the Job
A rig floor generates a WOB, RPM, torque and ROP reading every few seconds. Real-time drilling-optimization platforms like Corva ingest that stream, compute MSE continuously, and flag founder conditions or recommend parameter adjustments as drilling happens — the same calculation this article just walked through by hand, but running every few seconds instead of once when someone remembers to check. Service-company automation packages such as Halliburton’s LOGIX automation and remote operations platform push this a step further, closing the loop by adjusting surface parameters automatically rather than just alerting the driller. A 2024 industry announcement from AIQ, ADNOC, Baker Hughes and Corva describing a joint AI-ROP optimization project across ADNOC’s fields is a useful signal of where this is headed at scale: MSE-based optimization moving from a driller’s mental checklist to a standing, always-on layer of the drilling process.
Build a Simple MSE Tracker Yourself
You don’t need a rig-automation contract to start watching this number. If your daily drilling reports already capture WOB, RPM, torque and ROP, a few lines of Python will compute MSE for every recorded interval and flag anything that’s climbing while ROP flattens:
import math

def mse_psi(wob_lbf, bit_dia_in, rpm, torque_ftlbf, rop_ft_per_hr):
    ab = (math.pi / 4) * bit_dia_in ** 2
    return wob_lbf / ab + (120 * math.pi * rpm * torque_ftlbf) / (ab * rop_ft_per_hr)

before = mse_psi(20000, 8.5, 180, 3800, 35)
after = mse_psi(28000, 8.5, 110, 3200, 52)
print(f"Before: {before:,.0f} psi")   # Before: 130,200 psi
print(f"After:  {after:,.0f} psi")    # After:  45,470 psi
Run that function against every row of a drilling parameters log in a pandas dataframe, plot MSE alongside ROP over depth, and the founder intervals you’ve been drilling through unnoticed will show up as spikes that line up with flat or falling ROP — no rig-automation subscription required to get the first useful signal.
Expected Result, and How to Sanity-Check It
Run the worked example above through your own script and you should land on 130,200 psi and 45,470 psi — if your numbers are off by an order of magnitude, check that torque is in ft-lbf (not N·m) and ROP is in ft/hr (not ft/min), since those two unit mismatches account for almost every MSE calculation error reported in the field. As a broader sanity check, MSE should track roughly with the confined compressive strength of the rock you’re in once you’re drilling efficiently — a well-optimized interval in a formation with 20,000–30,000 psi compressive strength should show MSE somewhere in that same neighborhood, not multiples of it.
Three pitfalls worth watching for: first, torque measured at surface rather than at the bit includes drillstring friction losses, which inflates MSE and can make an efficient interval look like a founder condition — correct for this with a torque-and-drag model if you’re drilling a long lateral. Second, a worn or damaged bit will show elevated MSE even at parameters that used to work fine, which is a genuinely useful early-warning signal rather than a calculation error. Third, don’t chase MSE to zero — some energy always goes into friction and cuttings transport, so the goal is minimizing MSE relative to rock strength, not driving the raw number down indefinitely.
For the drilling-dynamics side of this same real-time surveillance stack, see our piece on how AI predicts stick-slip before it wrecks your BHA, and if you’re assembling the reporting layer that captures the WOB, RPM and torque values this calculation needs, our roundup of tools that automate daily drilling reports is a natural next stop. Engineers building out the directional side of the same well can also see our minimum curvature method automation tutorial for the survey-calculation half of the job.
Next time ROP flattens and the surface gauges don’t explain why, run the MSE calculation before you add more weight — it’s the one number on the rig that tells you whether you’re still cutting rock or just grinding it.
